
Bitcoin’s (BTC) rally stalled near $36,000, but the bulls have not hurried to book profits. According to Glassnode analysis, the Long-Term Holder metric, which are addresses holding Bitcoin for at least 155 days, supply is near an all-time high, while the Short-Term Holder, addresses holding coins for less than 155 days, supply is near an all-time low, indicating tightening Bitcoin supply.
Although the long-term looks positive, there could be fireworks in the short term. Bitcoin derivatives markets have seen a huge build-up of open interest, rising above $16 billion at the time of writing, per CoinGlass data. J. A. Maartunn, a contributor to on-chain analytics platform CryptoQuant, highlighted on X (previously Twitter) that increases in open interest above $12.2 billion have previously resulted in a minimum dip of 20%.

While Bitcoin risks a decline in the near term, traders have started accumulating select altcoins. That has resulted in solid rallies in several altcoins, which have broken out of long basing patterns and are showing signs of starting a new uptrend. Altcoins may witness bouts of profit-booking but are likely to remain in focus as long as Bitcoin does not crumble below $30,000.
What are the critical support levels in Bitcoin that need to hold for the uptrend to continue? Will the altcoin rally sustIain, or is it time to book profits?
Let’s analyze the charts of the top 10 cryptocurrencies to find out.
Bitcoin price analysis
Bitcoin continues to trade inside a narrow ascending channel pattern, indicating that buyers are cautious at the current levels.

The upsloping 20-day exponential moving average ($33,612) and the relative strength index (RSI) in the overbought zone indicate that the path of least resistance is to the upside. If buyers propel the price above the channel, it will suggest that the bulls are back in the driver’s seat. That could clear the path for a potential rally to $40,000. This level is likely to attract strong selling by the bears.
On the contrary, if the price turns down and plunges below the 20-day EMA, it will suggest that the bulls are booking profits. The BTC/USDT pair could then drop to $32,400 and eventually to $31,000.
Ether price analysis
Ether (ETH) has been slowly moving higher toward the significant resistance at $2,000. This is an important level to watch out for as the bears stalled the up-move at $2,000 on two previous occasions in May and July.

If the ETH/USDT pair does not give up much ground from $2,000, it will suggest that the bulls are holding on to their positions as they anticipate another leg higher. There is a minor resistance at $2,200, but if this level is scaled, the up-move may pick up momentum and skyrocket toward $3,500.
Instead, if the price turns down from the current level and breaks below the 20-day EMA ($1,800), the next stop is likely to be $1,746.
BNB price analysis
BNB (BNB) has been in a recovery phase for several days. The price reached $256 on Nov. 6, where the bears stepped in to stall the up-move.

Sellers will try to pull the price down to the 20-day EMA ($232), which is a necessary level to keep an eye on.
If the price rebounds off this level with strength, it will suggest that the sentiment remains positive and traders are viewing the dips as a buying opportunity. The BNB/USDT pair could then travel to $265, where the bears may again pose a substantial challenge.
Contrarily, if the price turns down and breaks below the 20-day EMA, it will indicate that the bears are back in the game.
XRP price analysis
XRP (XRP) climbed above the $0.67 resistance on Nov. 6, but the bulls could not surmount the next barrier at $0.74.

That may have tempted short-term bulls to book profits, which pulled the price below $0.67 on Nov. 7. The long tail on the day’s candlestick shows that lower levels continue to attract buyers. If the price remains above $0.63, it will improve the prospects of a retest of $0.74. Above this level, the XRP/USDT pair may rise to $0.85 and then to $1.
Contrary to this assumption, if the price breaks below $0.63, it will signal that the bullish momentum has weakened. The pair could then slip to the 20-day EMA ($0.60).
Solana price analysis
Solana (SOL) has been consolidating in an uptrend. The price is stuck between the overhead resistance at $48 and the support at $38.

Both moving averages are sloping up, and the RSI is in the overbought zone, indicating that the bulls have the upper hand. The price could climb to $48, which may witness a tough battle between the bulls and the bears. If bulls overcome this obstacle, the SOL/USDT pair could jump to $60.
If bears want to make a comeback, they will have to sink and sustain the price below the 20-day EMA ($36.30). That could start a deeper correction to the 50-day SMA ($27.35).
Cardano price analysis
Cardano (ADA) has been in a strong uptrend for the past few days. The price reached $0.38 on Nov. 6, where the bulls are likely to face solid resistance from the bears.

The price pulled back on Nov. 7, but a minor positive is that the bulls purchased at lower levels, as seen from the long tail on the candlestick. Buying indicates that the bulls expect the overhead resistance to be scaled.
If buyers drive and sustain the price above $0.38, the ADA/USDT pair could start the next leg of the uptrend to $0.42 and subsequently to $0.46. This positive view will be invalidated in the near term if the price breaks below $0.33.
Dogecoin price analysis
Buyers are trying to shove Dogecoin (DOGE) above $0.08. The previous attempt in July had fizzled out at this level; hence, the bears will again try to guard $0.08 with vigor.

The upsloping 20-day EMA ($0.07) and the RSI in the positive territory indicate that bulls have the edge. If buyers do not give up much ground from $0.08, it will increase the likelihood of a break above it. The DOGE/USDT pair could then surge toward the psychologically crucial level of $0.10.
If bears want to prevent the up-move, they will have to swiftly yank the price back below the 20-day EMA. That could signal a range-bound action between $0.06 and $0.08 for some time.
Related: Toncoin (TON) price skyrockets to 11-month high after Telegram launches ‘Giveaways’
Toncoin price analysis
Toncoin (TON) surged above the overhead resistance of $2.59 on Nov. 8, indicating that bulls are in control.
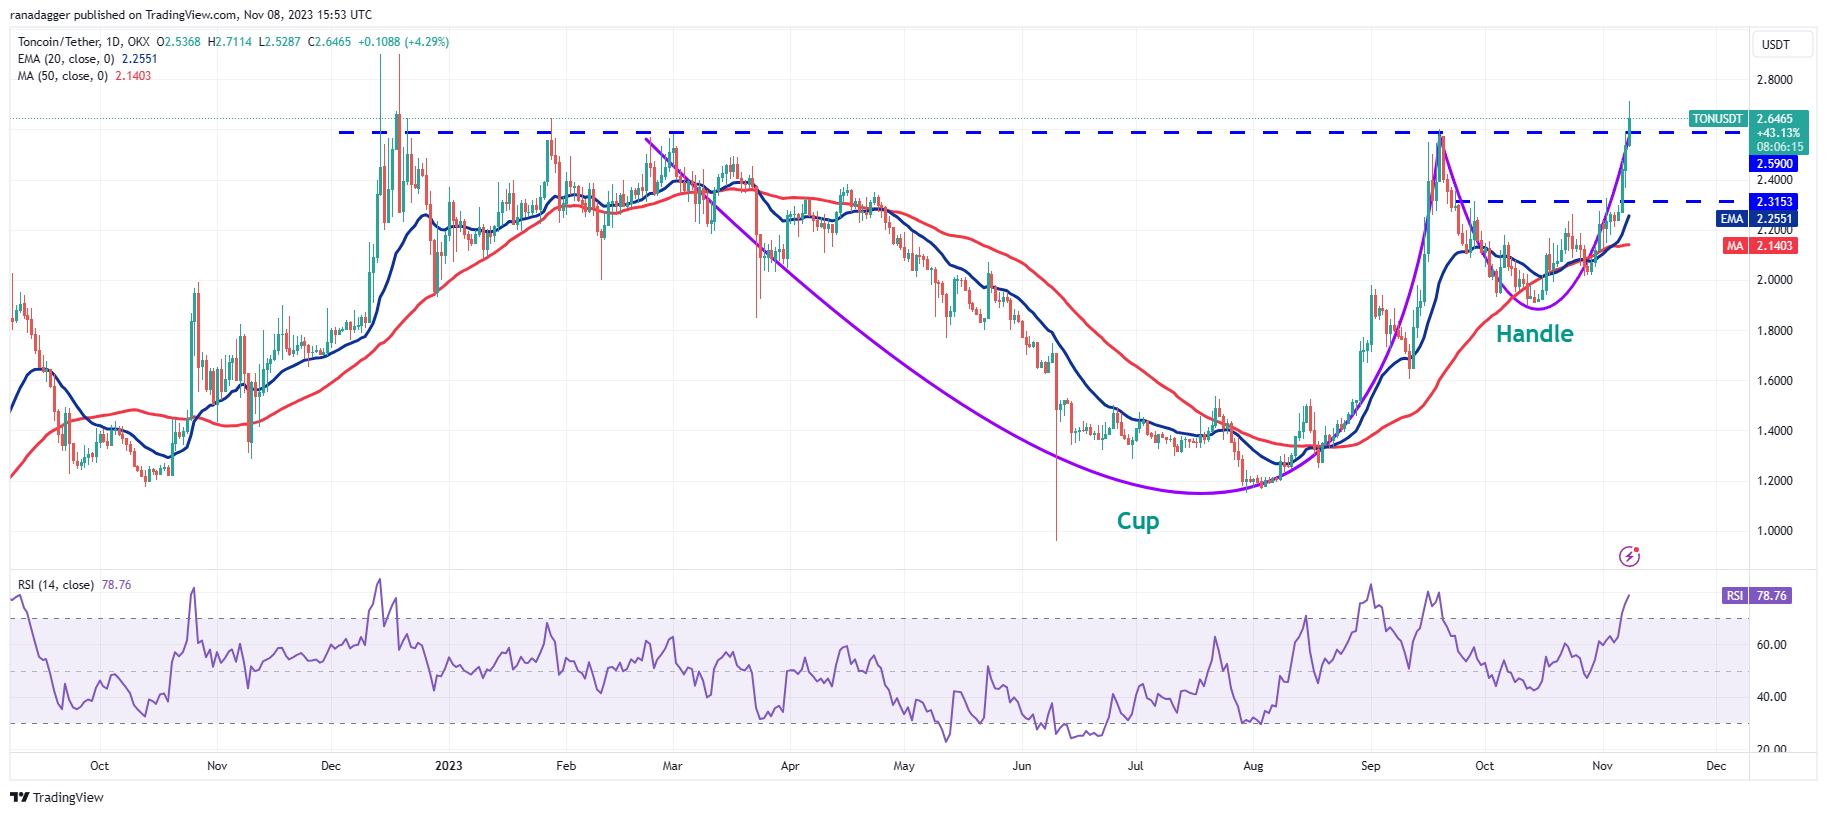
The price action of the past few months resulted in a cup and handle formation, which completed on a break and close above $2.59. This bullish setup has a target objective of $4.03.
However, the bears are unlikely to give up easily. They will try to tug and sustain the price below the breakout level of $2.59. If they manage to do that quickly, it may trap several aggressive bulls who could rush to the exit. The TON/USDT pair could then start a sharp correction to $2.31.
Chainlink price analysis
Chainlink (LINK) has been in an uptrend for the past few days. After a brief consolidation, the bulls asserted their supremacy and resumed the up-move on Nov. 5.

The rally has reached the resistance at $13.50, which may act as a temporary roadblock. If buyers bulldoze their way through, the LINK/USDT pair may jump to $15 and thereafter to $18. The bears are expected to fiercely defend this level.
The vital support to watch on the downside is the 20-day EMA ($11.18). A break and close below this support will indicate that the bullish momentum may be reducing.
Polygon price analysis
Polygon (MATIC) pierced the overhead resistance at $0.70 on Nov. 6, indicating that the bulls are in the driver’s seat.

The bears tried to pull the price back below the breakout level of $0.70 on Nov. 7, but the bulls held their ground. This suggests that the bulls have flipped the level into support. That started the next leg of the uptrend toward $0.80. This level may act as a minor hurdle, but if crossed, the MATIC/USDT pair could reach $0.90.
The rally of the past few days has pushed the RSI into the overbought territory, cautioning of a possible consolidation or correction in the near term. The pair may then drop to the 20-day EMA ($0.66).
This article does not contain investment advice or recommendations. Every investment and trading move involves risk, and readers should conduct their own research when making a decision.
Read More: cointelegraph.com


 Bitcoin
  Ethereum
  Tether
  BNB
BNB  Solana
  USDC
USDC  XRP
XRP  Dogecoin
  Toncoin
  Cardano
  Shiba Inu
  Avalanche
  Wrapped Bitcoin
  Bitcoin Cash
  Polkadot
  NEAR Protocol
  Polygon
  Litecoin
  Uniswap
  LEO Token
  First Digital USD
  Hedera
  Aptos
Aptos  Stellar
  Cosmos Hub
  Filecoin
  OKB
OKB  Render
  Immutable
  XT.com
  Pepe
Pepe  Arbitrum
  Bittensor
  Maker
Maker  dogwifhat
  Optimism
  Wrapped eETH
  The Graph