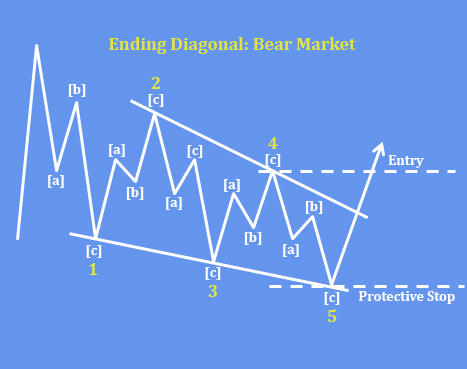
Zcash (ZECUSD) is trading bearish for the last year, but looking at the wave structure from Elliott wave perspective, we can see it forming and potentially finishing an ending diagonal a.k.a. wedge pattern within wave (C) of an (A)-(B)-(C) correction from the highs.
Looking at the ZECUSD daily chart, we can see a leading diagonal in wave (A), then a complex W-X-Y correction in wave (B), followed by final sell-off within the wedge formation within wave (C). Well, technically speaking, ZECUSD is trading at strong support zone, but at this stage it’s important to wait for confirmations. So, only if we see sharp rebound or impulsive recovery back above 83 first bullish evidence level, only then we can confirm support in place and bulls back in the game.
The ending diagonal (wedge) pattern is a special type of wave that occurs in wave 5 of an impulse. An ending diagonal pattern is a type of pattern that can occur at the completion of a strong move. It reflects a “calming” of the market sentiment such that price still moves generally in the direction of the larger move, but not strongly enough to produce an impulsive wave. Ending diagonals consist of five waves, labeled 1-2-3-4-5, where each wave subdivides into three legs. Waves 1 and 4 overlap in price, while wave 3 can not be the shortest amongst waves 1, 3 and 5.
LIMITE TIME OFFER for wavetraders services: Get 2 Months For Price of 1.
Read More: news.google.com


 Bitcoin
  Ethereum
  Tether
  XRP
XRP  Solana
  USDC
USDC  Dogecoin
  Cardano
  TRON
TRON  Lido Staked Ether
  Wrapped Bitcoin
  Toncoin
  Chainlink
  LEO Token
  Stellar
  USDS
USDS  Wrapped stETH
  Avalanche
  Shiba Inu
  Sui
Sui  Hedera
  Litecoin
  Polkadot
  MANTRA
  Bitcoin Cash
  Bitget Token
  WETH
WETH  Ethena USDe
  Binance Bridged USDT (BNB Smart Chain)
  Pi Network
  Hyperliquid
  Wrapped eETH
  WhiteBIT Coin
  Monero
  Uniswap
  Aptos
Aptos  Dai
Dai  NEAR Protocol
  Pepe
Pepe  sUSDS
sUSDS  OKB
OKB  Gate
Gate  Cronos
  Coinbase Wrapped BTC
  Mantle
  Tokenize Xchange
  Internet Computer
  Ethereum Classic