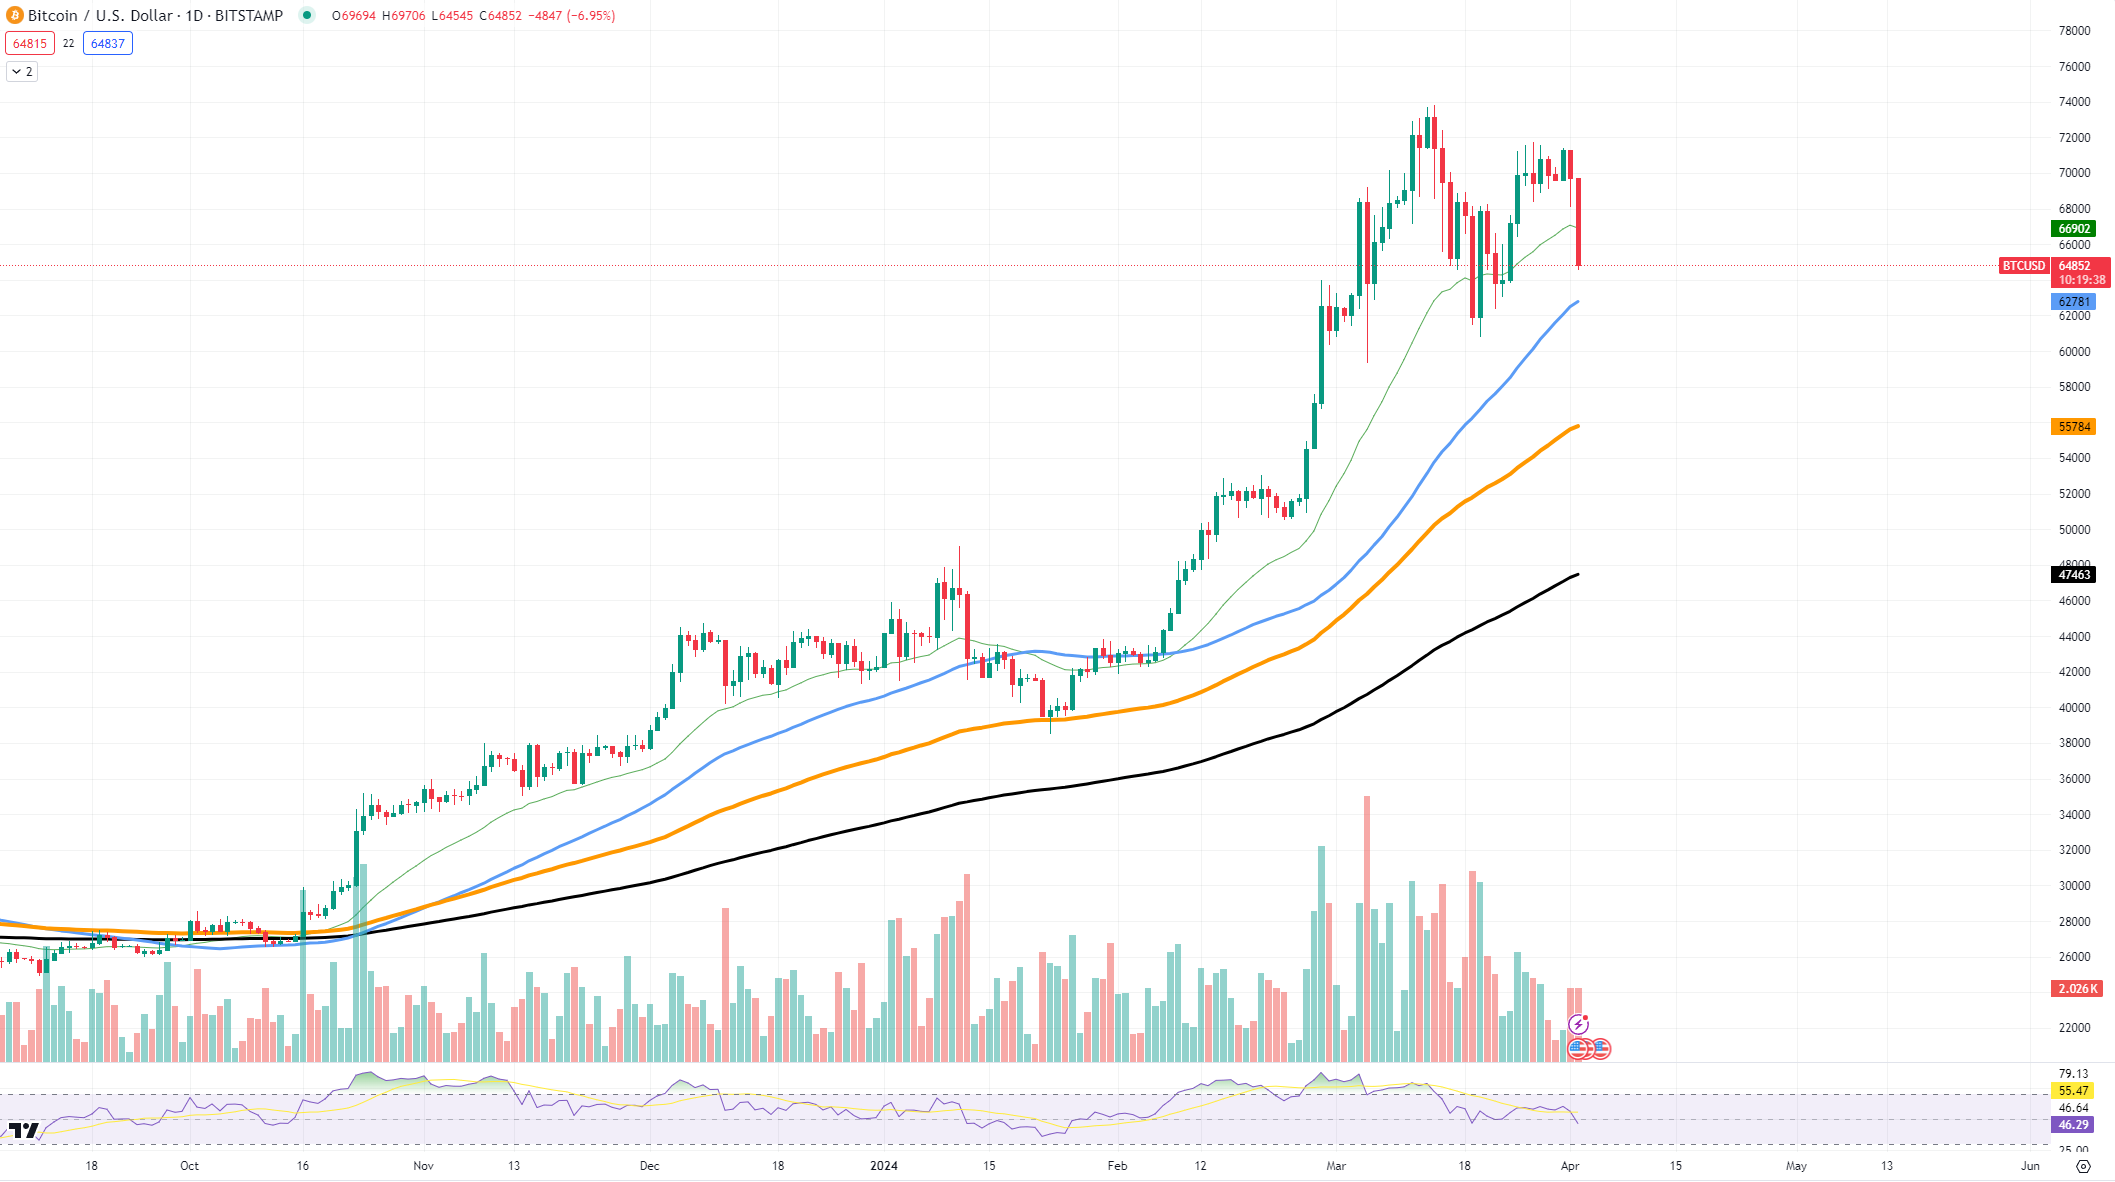
Bitcoin’s next halving event is the main fuel for the discussion about its future price, with most people anticipating $100,000.
The chart shows Bitcoin is currently experiencing fluctuations. If we follow past patterns, Bitcoin might show strong growth after the halving. But, it is also possible that this growth will not be as great as before, considering the market’s capitalization and the presence of institutional funds.

Right now, Bitcoin is trading around $65,493. It is important to look at the support level at $63,600. This is like a safety net – if the price does not fall below this, Bitcoin could start the bullish reversal again. The next support level is down at $47,474, which could come into play if the price drops further.
For Bitcoin’s price to reach $100,000, it would need to break past several resistance levels. The first big challenge is around $68,000. If it can stay above this, Bitcoin may continue to rise and possibly reach new highs.
What does this mean for the future? After the halving, Bitcoin could go up in price, maybe even reaching $100,000. However, it might not happen quickly or as strongly as some people hope. It is important to remember that other factors can influence Bitcoin’s price and that previous price performance is not a guarantee of a bullish future.
Will Ethereum reverse?
Ethereum is showing signs that it might be about to change its direction after a period of falling prices. The chart indicates that Ethereum is now close to the 50-day Exponential Moving Average. This could be a sign that a reversal, where the price starts to go up again, might happen soon.
When we look at the specific numbers on the chart, the 50 EMA is right near the price level of $3,300. If Ethereum’s price can stay above this line, it is a good hint that the price could start rising. On the other hand, if the price falls below 50 EMA, it could be the continuation of a descending price trend.
Right now, Ethereum’s price is hovering around $3,324.9. The next big resistance level is at $3,500. If the price of Ethereum can go past this point, it could be the start of a climb back up to even higher levels.
In general, the market is doing okay, so there might not be too much to worry about right now despite the correction we are seeing. However, Ethereum’s growth factors for now are mostly layer 2s and the potential approval of an Ethereum ETF, which will most likely be the only major capital injection Ether will see during this market cycle.
Solana’s weird behavior
Solana’s price moves have been quite mysterious lately. After breaking out of a pattern known as a symmetrical triangle, which often leads to a price rally, we saw a few days of gains. But then, surprisingly, the price did not enter a bull trend. Instead, we saw a bearish reversal, where the price started to fall again, which was not the most expected show out there.
On the chart, Solana’s price had risen above the triangle formation, reaching up to about $210. However, instead of continuing upward, it faced resistance and could not maintain the momentum. The price has fallen back to around $180.59, leaving many traders with losses and a lot of questions.
Looking closer, we can identify the key support level at $148.48, which is a price that could potentially stop further drops and help turn things around. If the price falls below this level, the next support is way down at $129.67, showing that there is quite a bit of room for a potential downside.
On the other hand, if Solana’s price can find some strength and start to go up again, the key resistance level to watch is around $213 – a price from the previous breakthrough.
Read More: u.today


 Bitcoin
  Ethereum
  Tether
  XRP
XRP  Solana
  USDC
USDC  Dogecoin
  TRON
TRON  Cardano
  Lido Staked Ether
  Wrapped Bitcoin
  Hyperliquid
  Sui
Sui  Wrapped stETH
  Chainlink
  Avalanche
  LEO Token
  Stellar
  Bitcoin Cash
  Toncoin
  Shiba Inu
  USDS
USDS  Hedera
  Litecoin
  WETH
WETH  Wrapped eETH
  Polkadot
  Binance Bridged USDT (BNB Smart Chain)
  Monero
  Ethena USDe
  Bitget Token
  Pepe
Pepe  Coinbase Wrapped BTC
  Pi Network
  WhiteBIT Coin
  Aave
Aave  Uniswap
  Dai
Dai  Ethena Staked USDe
  Bittensor
  OKB
OKB  Aptos
Aptos  BlackRock USD Institutional Digital Liquidity Fund
  NEAR Protocol
  Cronos
  Jito Staked SOL
  Internet Computer
  Ethereum Classic
  Ondo
Ondo