- ETH whales favor The Sandbox amid favorable YOY NFT revenue growth.
- SAND experiences extended demand despite being overbought.
The Sandbox just earned its way into the list of most used smart contracts among the top 100 ETH whales in the last 24 hours. But is this an indicator that the metaverse network is experiencing more demand?
Is your portfolio green? Check out the Sandbox Profit Calculator
WhaleStats has confirmed that The Sandbox received extra attention from ETH whales in the last 24 hours. Why is this important? This outcome suggests that the network is experiencing a flow of value and perhaps even an influx in demand for its offerings.
JUST IN: $SAND @TheSandboxGame once again a MOST USED smart contract among top 100 #ETH whales in 24hrs
Check the top 100 whales here: https://t.co/N5qqsCAH8j
(and hodl $BBW to see data for the top 5000!)#SAND #whalestats #babywhale #BBW pic.twitter.com/FABH9f6nbQ
— WhaleStats (tracking crypto whales) (@WhaleStats) January 21, 2023
On a related note, The Sandbox also released its real estate NFT sales data revealing an impressive 180% year-over-year growth. It also reported roughly $1.4 billion in sales during the same period. The Sandbox’s land market cap came in at $167 million, making it the third largest after Decentraland and Otherside.
Virtual Real Estate #NFTs soared with $1.4B in sales & 180% YoY growth. @TheSandboxGame boasts $167M+ LAND Market Cap across all #metaverse platforms, proving the value and potential of virtual worlds in the NFT space.
Read on for some more stats
courtesy of @ParcelNFT pic.twitter.com/jepOvfS58I
— The Sandbox (@TheSandboxGame) January 20, 2023
This has all taken place mostly during the bear market. Expectations are higher especially now that the crypto market has shifted gears in favor of the bulls.
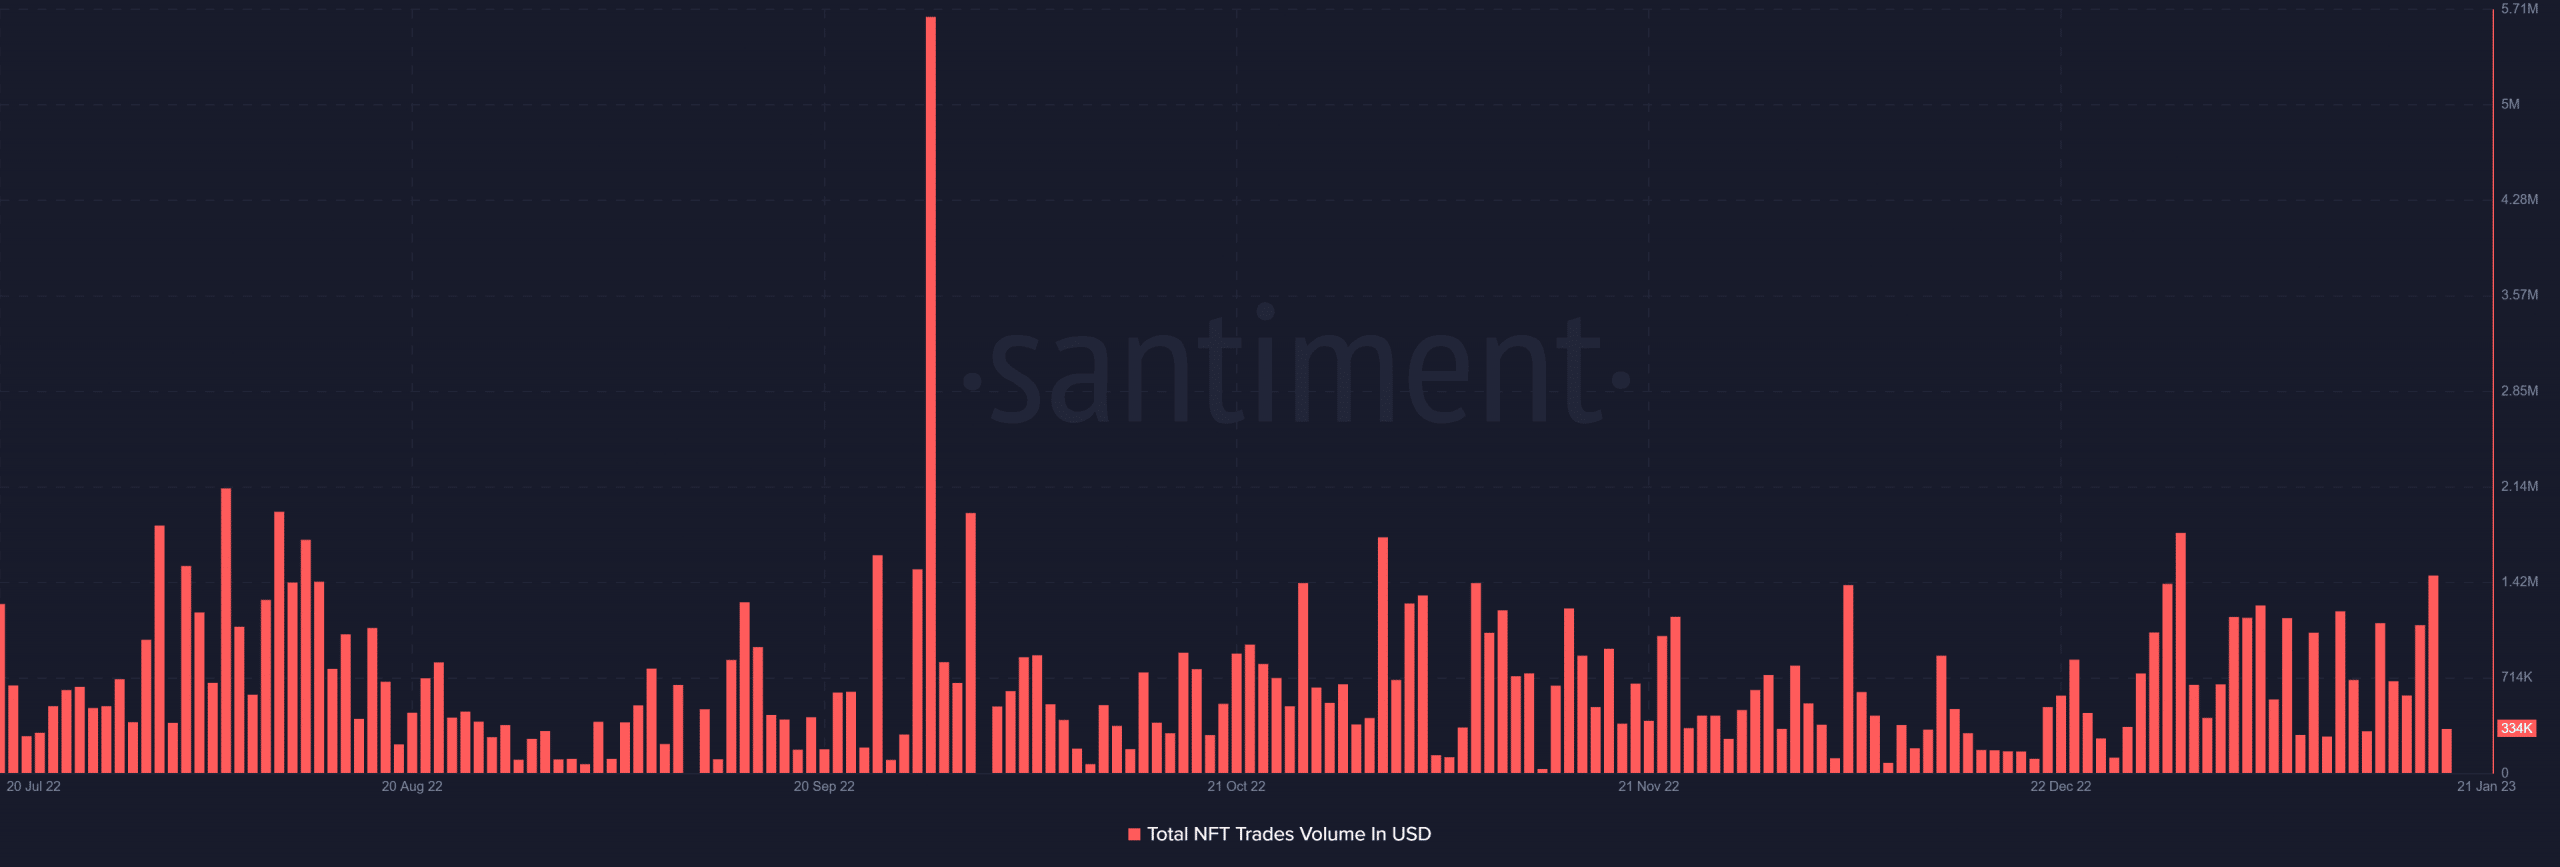
Perhaps the renewed interest from ETH whales is an indicator that it is already happening. An overview of The Sandbox’s NFT trades volumes confirms a healthy performance in the last six months.
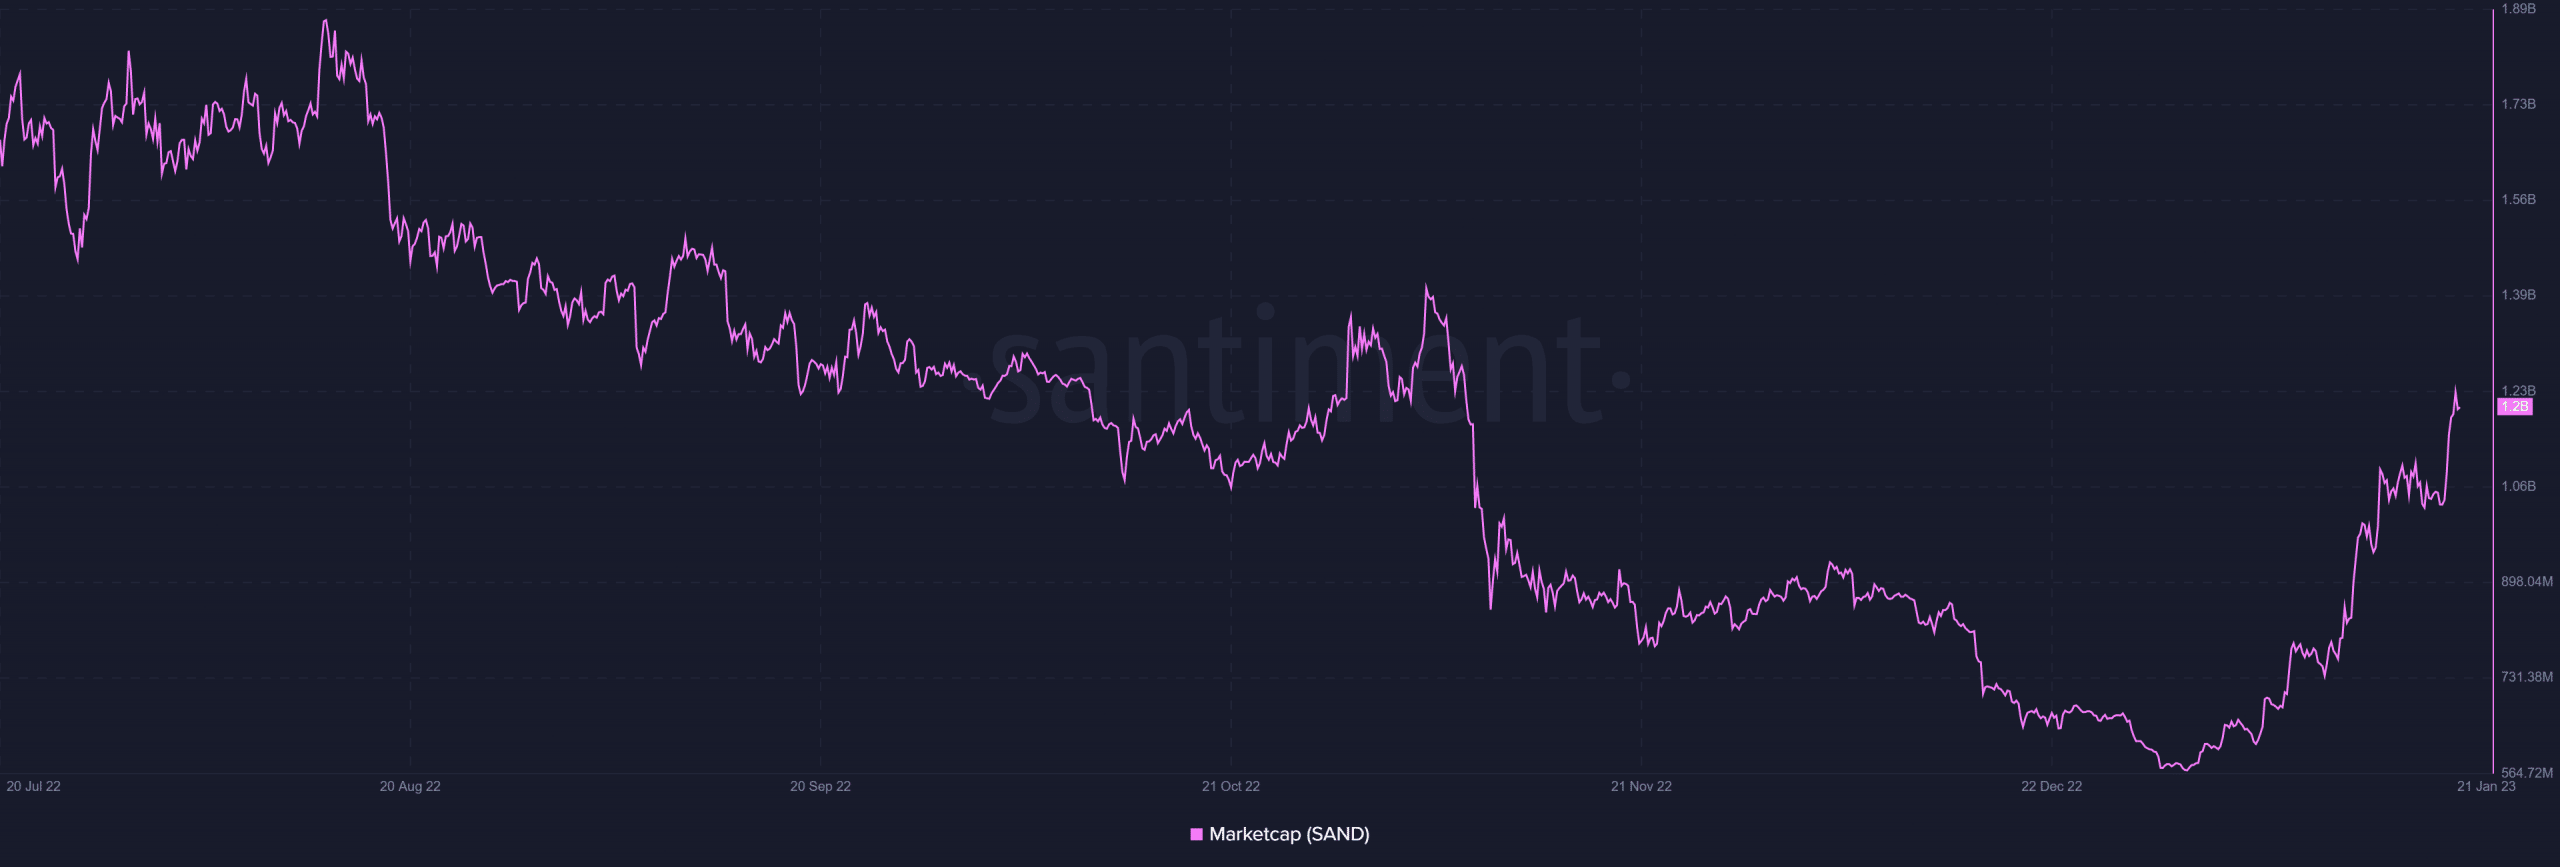
While SAND enjoyed healthy demand as far as land and other NFTs on its platform are concerned, it was not all rosy in other areas. For example, its market cap dropped off sharply in the past six months. This performance is more representative of the overall bearish market conditions.
Realistic or not, here’s The Sandbox’s market cap in BTC’s terms
Bulls are strong in SAND but what lies ahead?
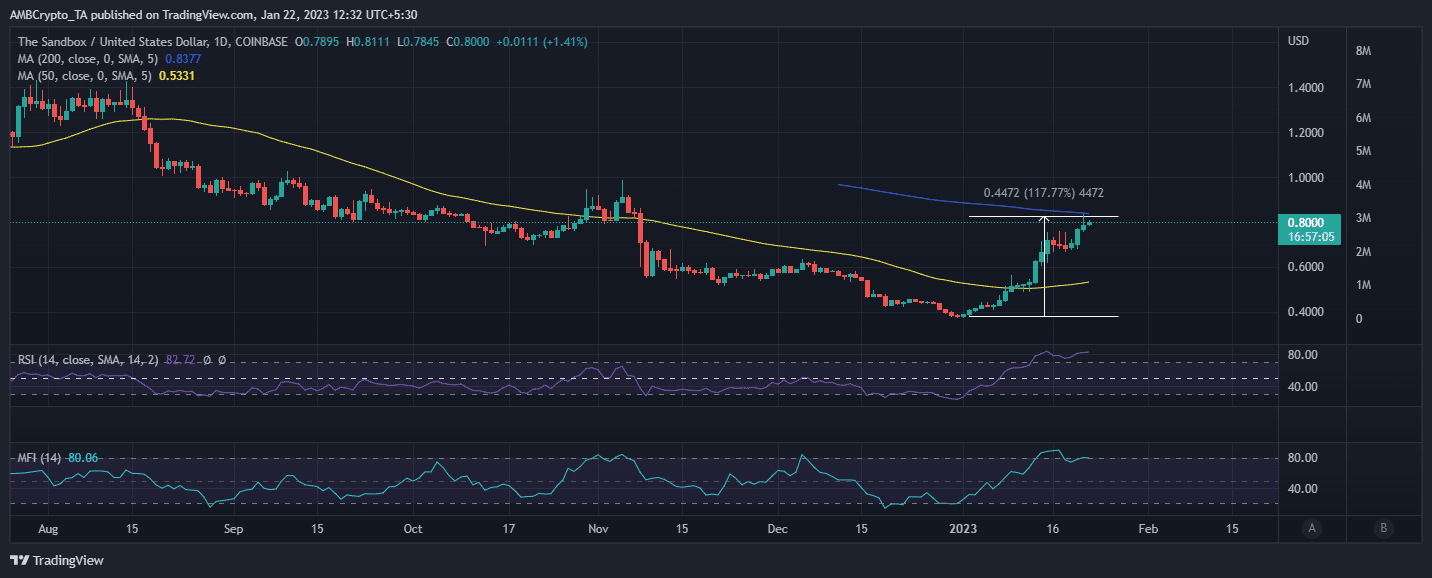
The Sandbox’s market cap has, however, enjoyed a healthy recovery in the last three weeks. This reflects on SAND’s price action which has been recovering since the start of this month. SAND is currently up by almost 118% from its current 12-month low. It is now approaching the 200-day MA but is already overbought.
There are signs suggesting that we may start witnessing potential bull trend weakness. For example, the supply held by top addresses saw a bit of a surge at the start of this month, but it dropped off sharply since 19 January. This suggests that the top addresses or whales are cashing out after the recent rally.
Prior to that, the mean coin age pivoted since mid-month, indicating that SAND was changing hands. In other words, more investors were tempted to take profits, but this was not enough to trigger a sizable pullback.
Perhaps SAND can sustain the rally for a while longer especially if healthy developments and organic demand can replenish favorable sentiment. However, the rally may not last long especially now that it is hovering above the overbought range.
Read More: news.google.com






 Treasure
  Unipoly
  Autonolas
  Rootstock Infrastructure Framework
  TrueFi
  TruFin Staked APT
  QuarkChain
  Felix feUSD
  BugsCoin
  SuperRare
  SpaceN
  DODO
DODO  Escoin
  Tensor
  doginme
  ROAM Token
  Marinade
  Shentu
  Mubarak
  Hippocrat
  LOFI
LOFI  Hunt
Hunt  Looped Hype
  Hippo Protocol
  Avalanche Bridged WETH (Avalanche)
  Sanctum Infinity
  dForce
  Zedxion
  Artificial Liquid Intelligence
  Sui Bridged Ether (Sui)
  Cobak
Cobak  Web 3 Dollar
  Dego Finance
  Quai Network
  BIM
BIM  Gemini Dollar
  Wayfinder
  Alephium
  Housecoin
  Overnight.fi USD+
  Mountain Protocol USD
  Sygnum FIUSD Liquidity Fund
  NEURALAI
  Avalanche Bridged WBTC (Avalanche)
  HashKey Platform Token
  Ekubo Protocol