Get the best data-driven crypto insights and analysis every week:
By: Tanay Ved & Matías Andrade
-
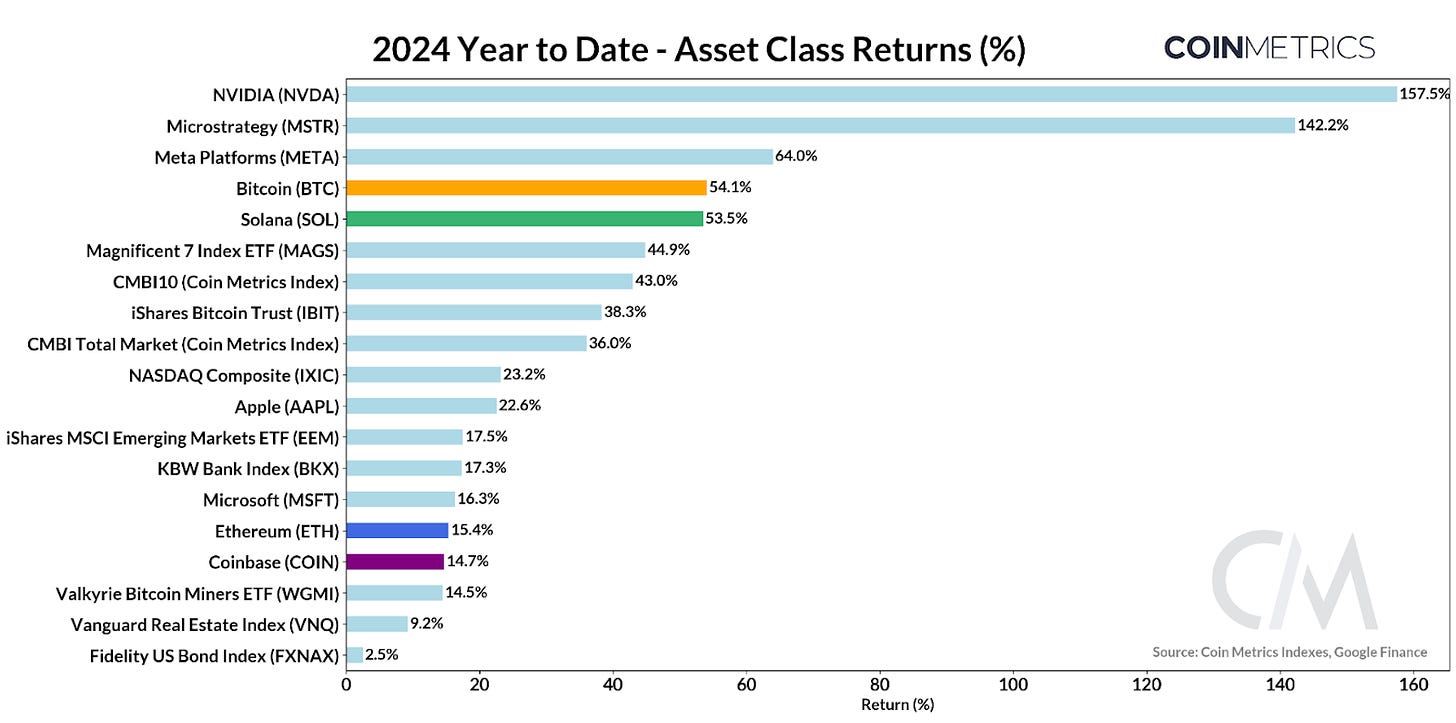
Despite volatility from factors like Mt. Gox repayments and the Yen carry trade, Bitcoin demonstrated remarkable stability. BTC and SOL lead performance YTD (+54% and +53% respectively).
-
Ethereum ETFs debuted in August, seeing weaker inflows, and reduced validator profitability amid lower Layer-1 network activity post-Dencun upgrade. The impact of Ethereum’s rollup-centric scaling roadmap and value accrual continue to evolve.
-
The DeFi sector saw significant activity, including Maker’s rebrand to the “Sky Ecosystem” & Wrapped-Bitcoin’s (WBTC) restructuring from BitGo.
In this special edition of State of the Network, we take a data-driven look at major developments that impacted the digital assets industry in Q3 2024.
Q3 2024 was characterized by a combination of catalysts and market pressures, inducing bouts of market volatility. In the face of long-awaited creditor repayments, market selling from prominent entities and the side-effects of the Yen-carry trade, on-chain infrastructure remained resilient, Bitcoin (BTC) displayed remarkable stability and the stablecoins continued their expansion.
Over the course of 2024, BTC remains the best performing crypto-asset (+54%), followed by SOL (53%), while Microstrategy (MSTR) is having a strong year on the back of its bitcoin buying spree. Ethereum entered the ETF sphere in August, but displayed weaker performance failing to garner strong inflows relative to Bitcoin, as on-chain activity reached a low. The Federal Reserve moved to cut interest rates by 50 basis points during the September FOMC, marking a reduction in the federal funds rate for the first time in 4 years. This had a notable impact across various asset classes as investors digested implications of the cut, creating subsequent volatility and a positive outlook for technology stocks and cryptocurrencies alike.
Source: Coin Metrics Reference Rates, Google Finance
Examining the performance of the top 30 crypto-assets in the datonomy™ universe with a market capitalization over $1B in Q3 reveals assets with strong tailwinds. Specifically, Sui (SUI)—a high-throughput Layer–1 blockchain based on the Move programming language (originally developed by Facebook for its Diem project) outperformed in September, with a 116% return over Q3. Aave (AAVE), the largest on-chain lending and borrowing protocol displayed strength across the entire quarter, rising by 71% on the back of improving fundamentals, major governance proposals acting as catalysts for tokenomics and a revival of DeFi liquidity.
Source: Coin Metrics Reference Rates
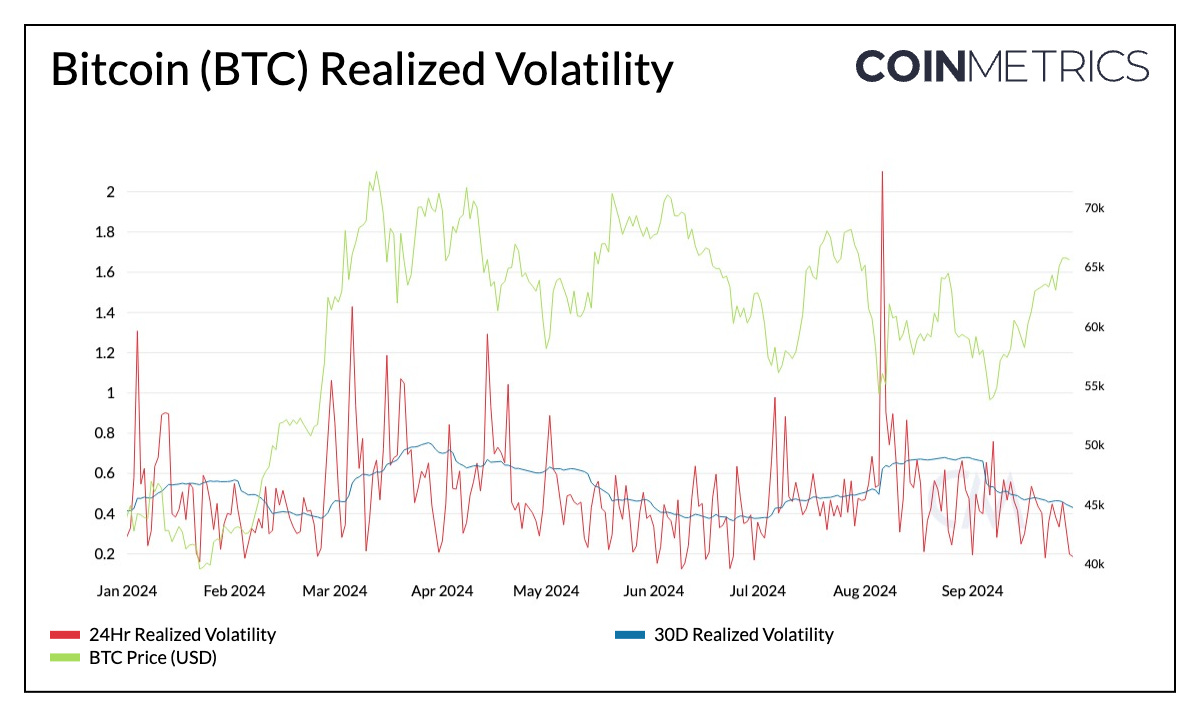
The Bitcoin (BTC) Realized Volatility chart from Coin Metrics offers a compelling view of market dynamics, showcasing both 24-hour and 30-day realized volatility metrics. A standout feature is the significant volatility spike in late July 2024, a period when Mt.Gox creditor repayments commenced through exchanges like Kraken and Bitstamp, alongside a series of transactions where Jump Crypto sent large amounts of ETH to exchanges.
The 24-hour metric briefly also exceeded 200%, which resulted from a large dip in the price of Bitcoin and accompanying leverage trader liquidations on August 5th surrounding the Japanese Yen carry trade when prices briefly reached back down to $53K. This spike is contextualized by the gradual rise in 30-day volatility around the same period, suggesting a sustained impact on market conditions as Bitcoin’s price traded lower for 5 consecutive days. As the chart progresses towards September, volatility exhibits a downward trend.
Source: Coin Metrics Market Data Feed
Despite a slew of market pressures arising from German Government selling and Mt.Gox liquidations, Bitcoin’s liquidity remains robust. BTC’s market depth within 2% of mid-price across Coin Metrics’ suite of exchanges ranges between $50-$100M, with a recent expansion towards $150M ($12B in average daily volumes), suggesting adequate liquidity to stabilize major price impacts.
Source: Coin Metrics Market Data Feed
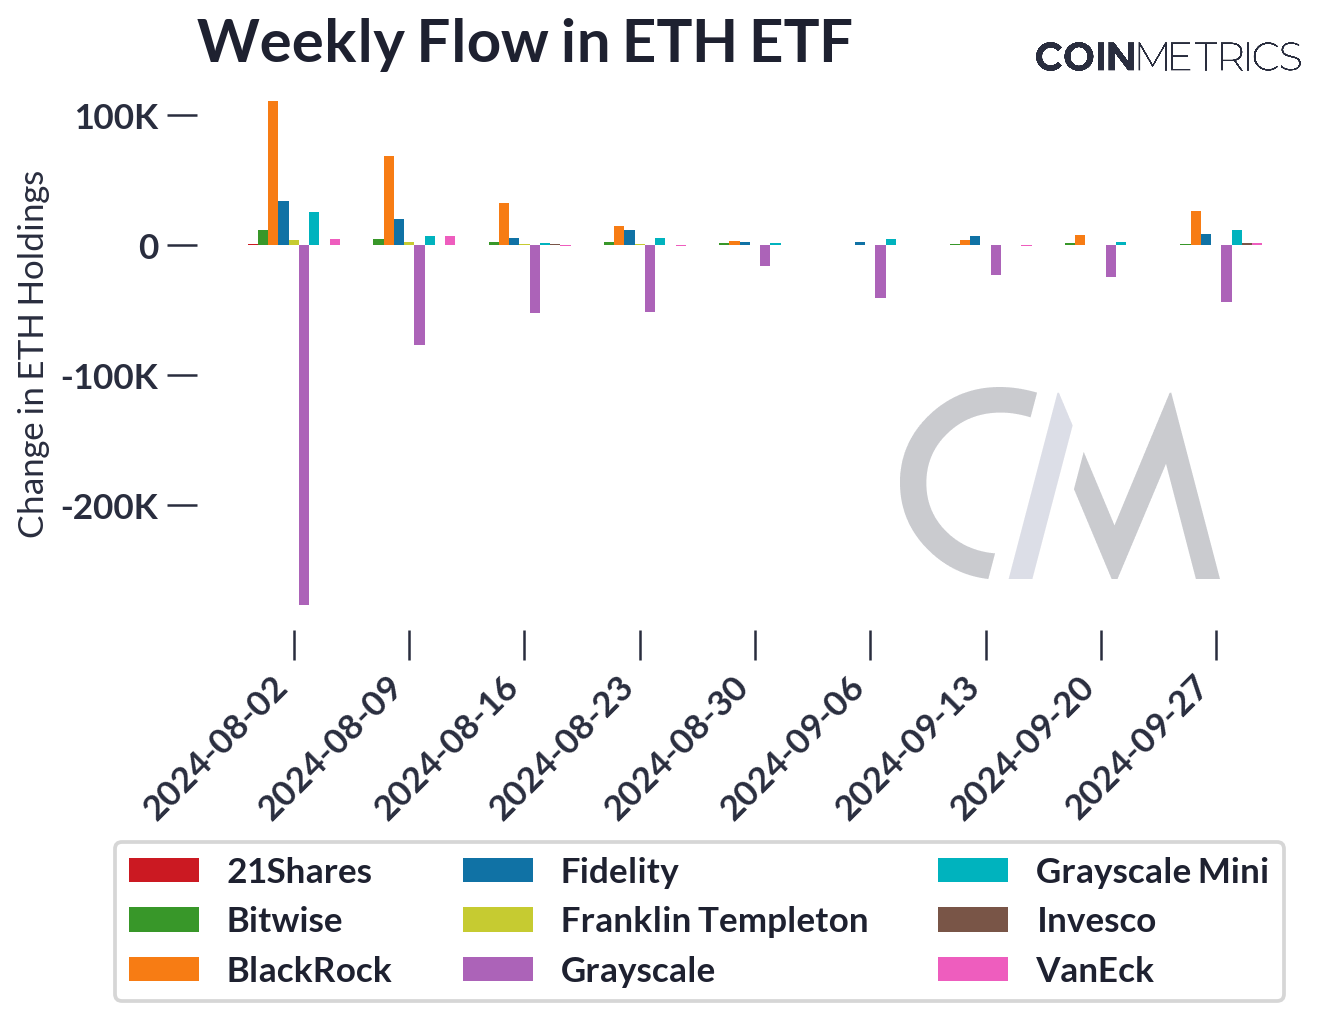
On July 23, a little over five months since the Bitcoin ETF was approved, the SEC extended their approval for the Ether ETF. Although on-chain holdings now reach upwards of $7.4B, we have seen net flows of –163M ETH since the inception of the ETF, mostly leaving from Grayscale’s Ethereum Trust (ETHE) upon conversion to an ETF which levies much higher fees than its competitors.
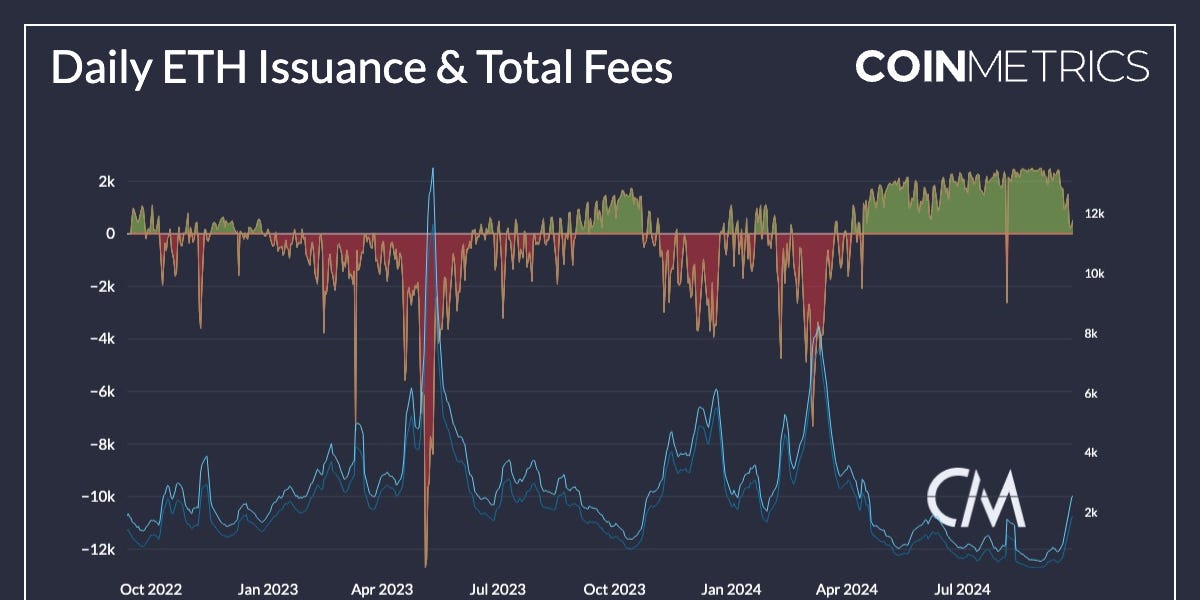
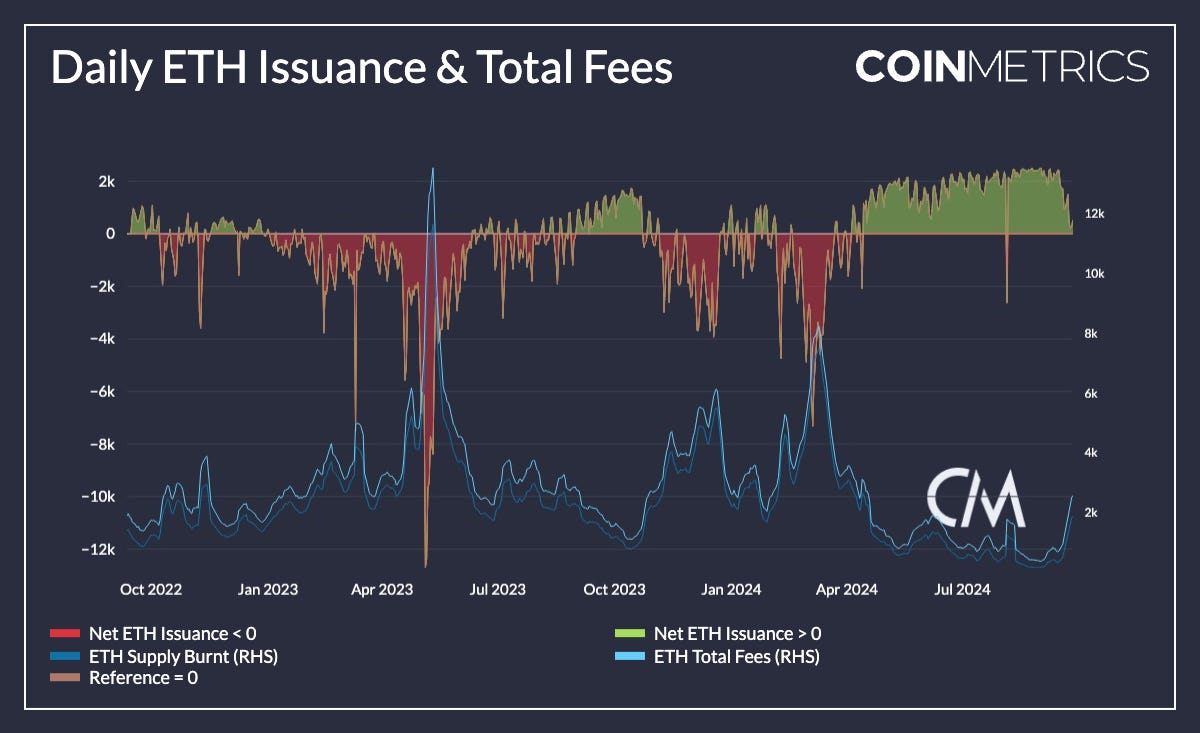
This weakness in ETH ETF performance, especially compared to Bitcoin’s ETFs, might have something to do with the emergence of a pessimistic narrative surrounding Ethereum’s rollup-centric scaling roadmap and value accrual to ETH. Since the Dencun upgrade, and in particular after EIP–4844, Layer–2 networks leveraging Ethereum as a data availability (DA) layer have enjoyed a new marketplace for data, in the form of blobs, and considerably lower fees to post data on Ethereum. The reduced fee pressure on the base layer, while beneficial for growing economic activity in the Ethereum ecosystem, has led to decreased validator profitability and a shift in Ethereum’s deflationary mechanics.
Source: Coin Metrics Network Data Pro
The graph illustrates the interplay between net ETH issuance, supply burnt, and total fees, revealing shifts in Ethereum’s monetary policy post-Dencun upgrade. Notably, since April 2024, there’s a marked increase in positive net ETH issuance (green area), coinciding with a decrease in both total fees and supply burnt (blue lines). This trend aligns with the narrative surrounding the implementation of EIP-4844, arguably also occurring in a period when network activity declined across several chains. However, as evident during the latter parts of September, on-chain activity and subsequently Ethereum total fees have seen an uptick, with ~2000 ETH burnt on average.
While fees from blobs may not appear to be the best form of value capture for ETH, it is likely that valuable activity will continue to occur on Ethereum, sustaining a healthier equilibrium between network accessibility and value capture over the longer term.
In Q3, the decentralized finance (DeFi) sector was also in the limelight, with fundamental catalysts, ecosystem specific rebrands and restructurings central to the discussion. Aave, the largest money market protocol with $20B in assets supplied across markets on 13 networks is one of the highest revenue generating protocols in the ecosystem.
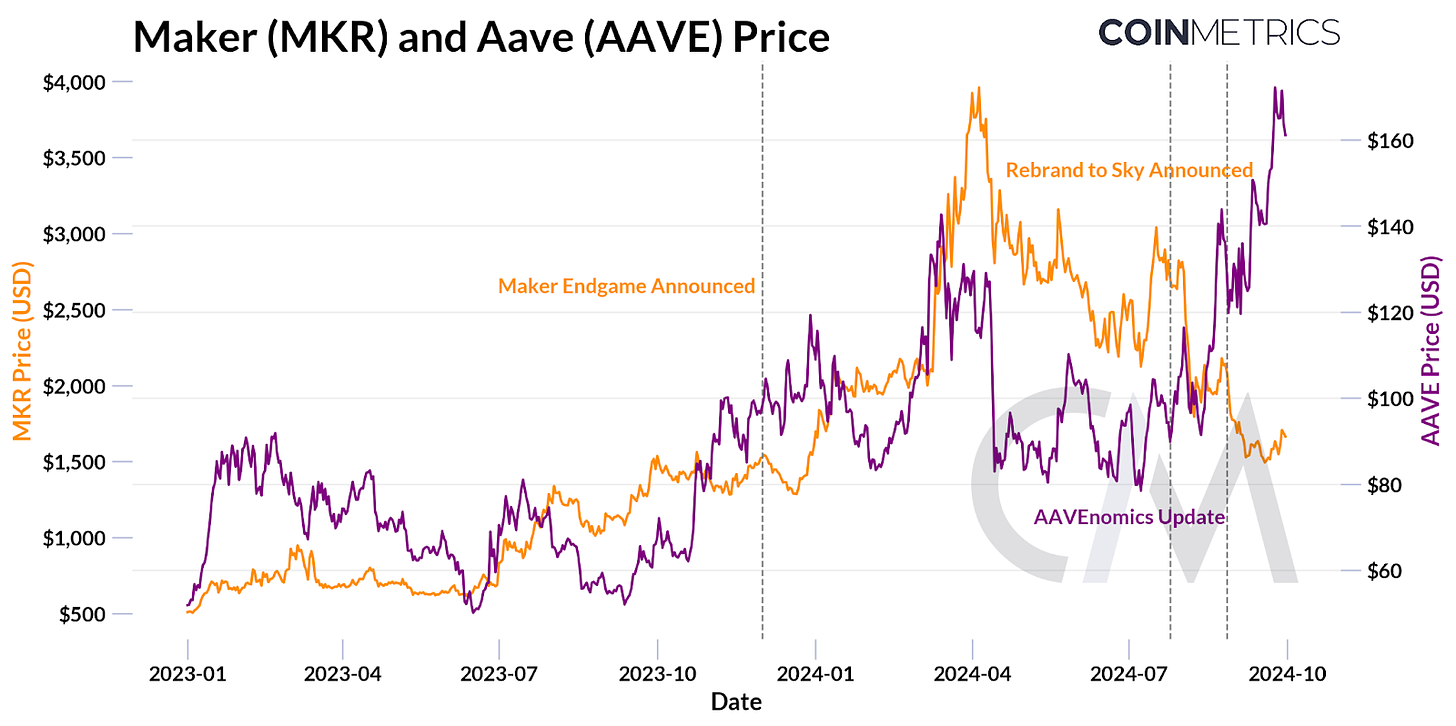
As a result of this maturity, a governance proposal was introduced aiming to implement a “Buy and Distribute” program—leveraging the protocol’s excess revenue to buy back AAVE tokens from the open market. This has revamped Aave’s tokenomics, enhancing the utility and appeal of the token and subsequently resulted in strong price action. Other proposals, such as the integration of BlackRock’s BUIDL shares and other RWAs to diversify revenue streams, and the attractiveness of DeFi yields amid interest rate cuts also act as fundamental tailwinds for the sector.
Source: Coin Metrics Reference Rates
As a part of the “Endgame”, Maker underwent a rebrand to the “Sky Ecosystem” with its stablecoin DAI and governance token MKR being known as USDS and SKY going forward. Makers subDAO’s, which functioned as independent units of the protocol will now be known as “Sky Stars”, with Spark Protocol —a lending and borrowing protocol with nearly $4B in deposits aiming to grow the USDS ecosystem via crypto-assets and tokenized RWAs. While the rebrand is still in its early stages, MKR’s price action has shown weakness, suggesting that the market still needs to grasp the complexity of these changes and digest its outcomes.
Source: Coin Metrics ATLAS
On August 9th, BitGo announced plans to restructure WBTC’s oversight through a joint venture with BiT Global, involving Justin Sun. This partnership raised eyebrows across the industry, particularly among DeFi protocols offering WBTC collateral markets. Sky (formerly MakerDAO) swiftly reacted by preventing new borrows against WBTC. Consequently, while 5,610 WBTC ($358M) remains in Maker Vaults and Spark Protocol, Aave V3 has seen an all-time high of 35,000 WBTC ($2.2B) supplied as WBTC holders migrate their assets. In response, several Bitcoin-based derivatives have emerged, including Coinbase’s cbBTC and Threshold’s tBTC. These offerings have been onboarded as collateral on various platforms, further expanding exposure to Bitcoin-collateralized assets.
Q3 2024 presented a dynamic landscape of catalysts and challenges, resulting in increased crypto market volatility. Despite this, several assets and market segments demonstrated resilience, with Bitcoin showcasing its stability. As we look towards Q4, the U.S. elections and evolving digital asset policies stand out as pivotal factors shaping the market. Entering a low interest-rate environment for the first time in 4 years, following one of the Federal Reserve’s most aggressive tightening cycles, the outlook for crypto-assets remains optimistic as stablecoins continue to march towards record highs while signs of a revival in both valuations and on-chain activity emerges.
This quarter’s updates from the Coin Metrics team:
As always, if you have any feedback or requests please let us know here.
Coin Metrics’ State of the Network, is an unbiased, weekly view of the crypto market informed by our own network (on-chain) and market data.
If you’d like to get State of the Network in your inbox, please subscribe here. You can see previous issues of State of the Network here.
© 2024 Coin Metrics Inc. All rights reserved. Redistribution is not permitted without consent. This newsletter does not constitute investment advice and is for informational purposes only and you should not make an investment decision on the basis of this information. The newsletter is provided “as is” and Coin Metrics will not be liable for any loss or damage resulting from information obtained from the newsletter.
Read More: coinmetrics.substack.com






 Bitcoin
  Ethereum
  Tether
  XRP
XRP  Solana
  USDC
USDC  Dogecoin
  TRON
TRON  Cardano
  Lido Staked Ether
  Wrapped Bitcoin
  Hyperliquid
  Wrapped stETH
  Sui
Sui  Chainlink
  Avalanche
  Stellar
  LEO Token
  Bitcoin Cash
  Toncoin
  Shiba Inu
  USDS
USDS  Hedera
  Wrapped eETH
  WETH
WETH  Litecoin
  Polkadot
  Monero
  Binance Bridged USDT (BNB Smart Chain)
  Ethena USDe
  Bitget Token
  Pepe
Pepe  Pi Network
  Coinbase Wrapped BTC
  WhiteBIT Coin
  Aave
Aave  Uniswap
  Dai
Dai  Ethena Staked USDe
  Bittensor
  Aptos
Aptos  Cronos
  OKB
OKB  NEAR Protocol
  BlackRock USD Institutional Digital Liquidity Fund
  Jito Staked SOL
  Internet Computer
  Ethereum Classic
  sUSDS
sUSDS