Disclaimer: The findings of the following analysis are the sole opinions of the writer and should not be considered investment advice
- Solana fell beneath the $12.3 support level
- The higher timeframe structure was also strongly bearish
Since 10 November, Solana has been able to hold on to the $12.5 region as support. In the past couple of days of trading, the selling pressure proved too much for demand to keep up with, and prices took a hit. In the same period, Bitcoin also fell beneath a crucial support level at $16.2k.
Read Solana’s [SOL] Price Prediction 2023-24
The prediction bot goes for a value of $9.33 as the most bearish scenario for Solana in 2022. From a technical perspective, this target could be hit in the next month. How can bears look to profit in the short term?
The short-term bullish order block at $12.5 was beaten
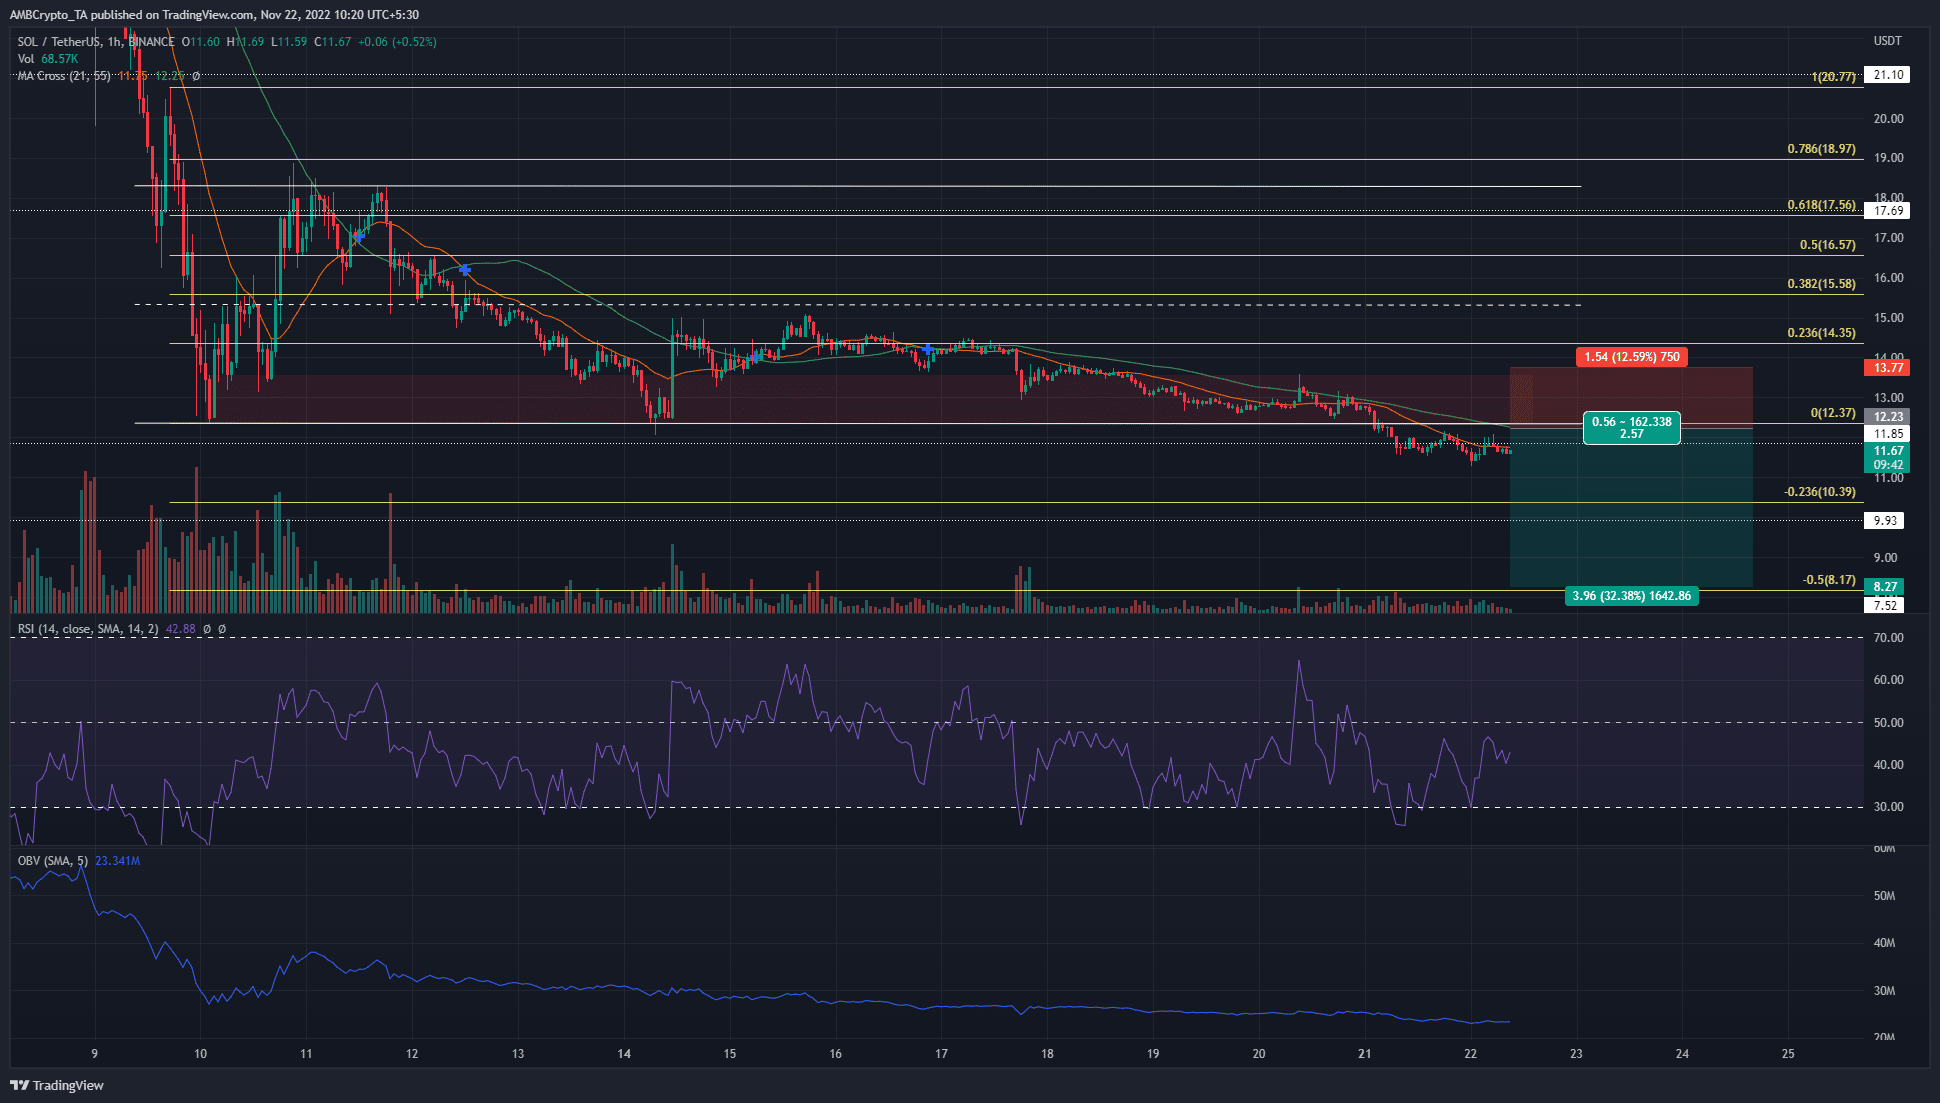
On 10 November, Solana fell as low as $12.37. Immediately thereafter, demand flooded into the market and propelled SOL to $18.3, just 18 hours later. In doing so, Solana established a short-term range (white) between these two levels. Another interesting development was that the $12.37-$13.57 region was demarcated as a bullish order block on the lower timeframes.
However, the outlook for Solana has not been bullish since then. The price was in steady decline over the past week, and was unable to climb past the mid-range resistance level at $15.33 (dashed white). In the past two days, Solana fell beneath the $12.3 level, and bearish dominance was evident once again.
A set of Fibonacci retracement levels (yellow) were plotted based on SOL’s drop from $20.77 to $12.37 on 9 November. They showed the 23.6% extension level to lie at $10.39, and the 50% extension level at $8.17.
The aforementioned bullish order block has now been flipped to a bearish breaker. A retest of this same zone would offer a selling opportunity, with invalidation above $13.65. The moving averages (21 and 55-period) will also pose resistance to SOL. The Relative Strength Index (RSI) was beneath the neutral 50 mark in the past week, with a brief foray above 50. The On-Balance Volume (OBV) also steadily crept lower. Therefore all the indicators agree upon selling pressure and bearish momentum.
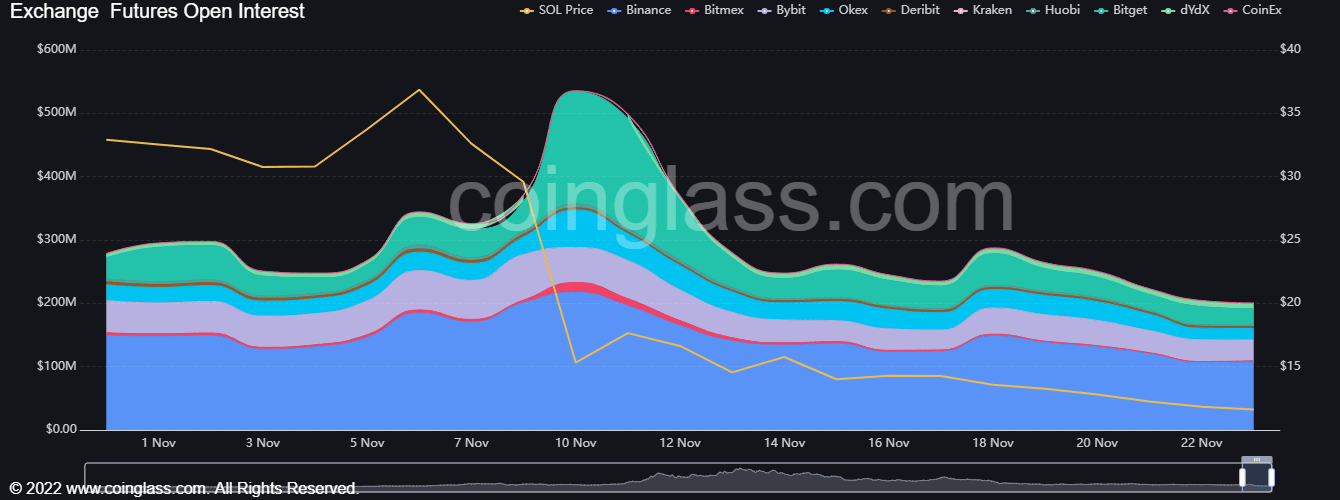
Open Interest declines while short positions take the driver’s seat

Source: Coinglass
The Open Interest peaked on 10 November as the sellers clambered into the market. The short-trade was overcrowded at that time, a fact that the funding rate made abundantly clear. At the time of writing as well, funding rate was slightly in the negative territory to show that bearish sentiment was beginning to take hold. But, the lack of a rise in OI meant that strong conviction might not be present yet.

Source: Coinglass
The long/short ratio stood at 1.08 in favor of the bulls for the past 24 hours, who held 51.4% of the market according to Coinglass data. Based on all the evidence at hand, it was likely that bearish pressure remained dominant. Any move toward $12-$12.3 would offer a selling opportunity.
Read More: ambcrypto.com


 Bitcoin
  Ethereum
  Tether
  XRP
XRP  Solana
  USDC
USDC  Dogecoin
  Cardano
  TRON
TRON  Lido Staked Ether
  Wrapped Bitcoin
  Sui
Sui  Chainlink
  Avalanche
  LEO Token
  Stellar
  USDS
USDS  Toncoin
  Shiba Inu
  Wrapped stETH
  Hedera
  Bitcoin Cash
  Hyperliquid
  Litecoin
  Polkadot
  WETH
WETH  Binance Bridged USDT (BNB Smart Chain)
  Bitget Token
  Monero
  Ethena USDe
  Pi Network
  WhiteBIT Coin
  Coinbase Wrapped BTC
  Wrapped eETH
  Pepe
Pepe  Dai
Dai  Aptos
Aptos  sUSDS
sUSDS  OKB
OKB  Bittensor
  Uniswap
  NEAR Protocol
  BlackRock USD Institutional Digital Liquidity Fund
  Ondo
Ondo  Aave
Aave  Gate
Gate  Ethereum Classic
  Tokenize Xchange
  Mantle