[ad_1]
- Optimism outperformed Arbitrum in terms of user retention.
- OP’s revenue increased, but on-chain metrics and market indicators remained bearish.
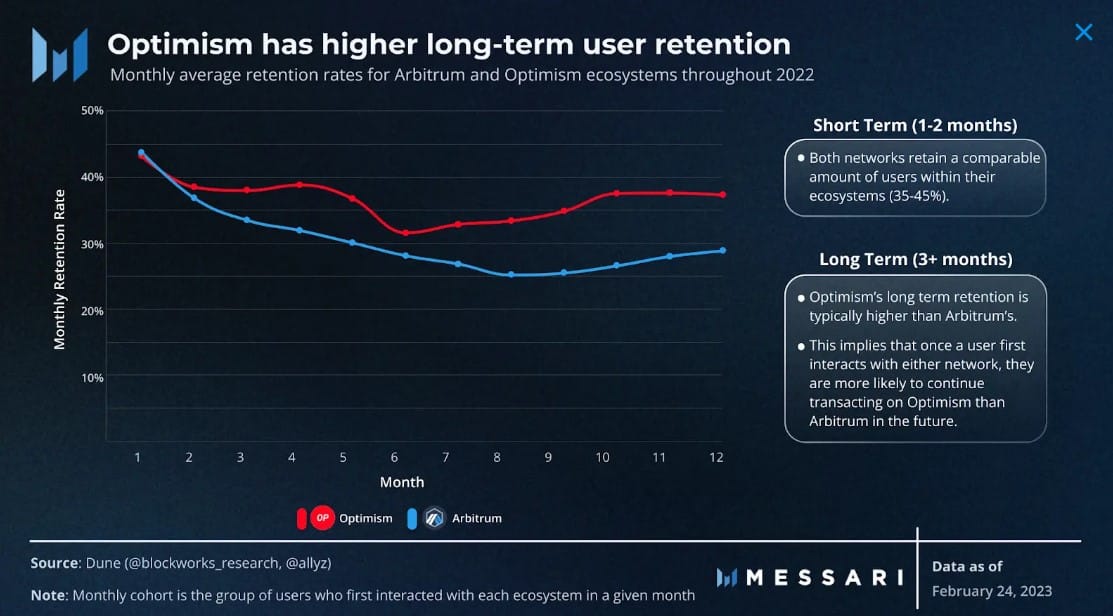
On 2 March, Messari published a report comparing Optimism [OP] and Arbitrum. The report mentioned that while Arbitrum may have relied on organic growth, Optimism concentrated on providing incentives for users to reach its 3-million unique user milestone throughout the previous year.
4/ To better comprehend retention rates on @arbitrum and @optimismFND based on cohort analysis and application level retention, check out the full Pro report from @0xallyzach.https://t.co/ZO8rcglfL5
— Messari (@MessariCrypto) March 2, 2023
How much are 1,10,100 OPs worth today?
Optimism’s user retention is praiseworthy
As per the report, in the short term, 35–45% of new users were retained by both Arbitrum and Optimism, although Optimism retained a larger percentage of its long-term user base. Though both the short- and long-term retention rates are valuable metrics, the latter is more important in order to understand the value of a blockchain.
Moreover, Optimism’s long-term retention was considerably higher than that of Arbtrum, suggesting more users’ trust in the L2 blockchain.
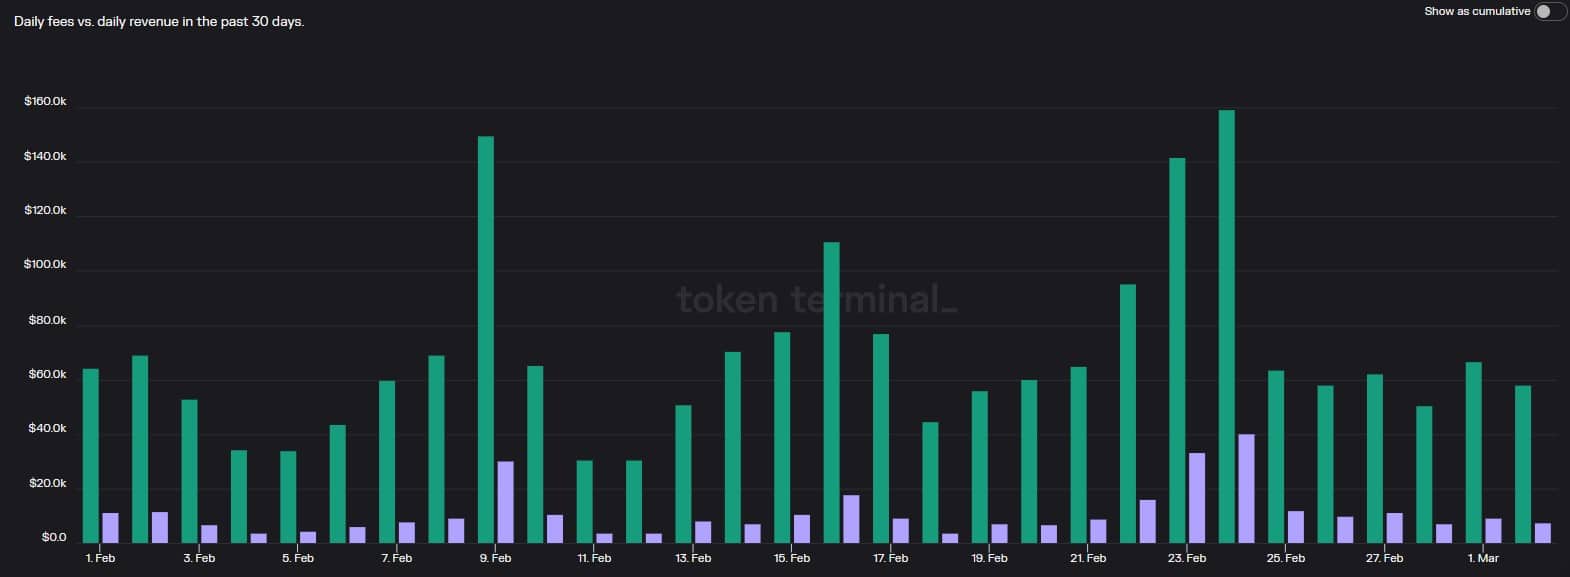
Interestingly, while OP’s retention rate registered a hike, Token Terminal’s data revealed that the same remained true for the blockchain’s fees. OP’s network fees and revenue both went up over the last 30 days, indicating increased usage.
Further growth in the Optimism network can be expected as the blockchain approaches the date of the much-awaited Bedrock upgrade. The new upgrade is expected to go live in March, and it will considerably reduce usage fees on the mainnet.
OP, however, was feeling the heat
While the aforementioned data pointed out strong performance on the network, Optimism’s native token had reasons for concern as its price declined by over 17% in the last seven days. According to CoinMarketCap, OP was down by 5.5% in the last 24 hours alone, and at the time of writing, it was trading at $2.56 with a market capitalization of over $805 million.
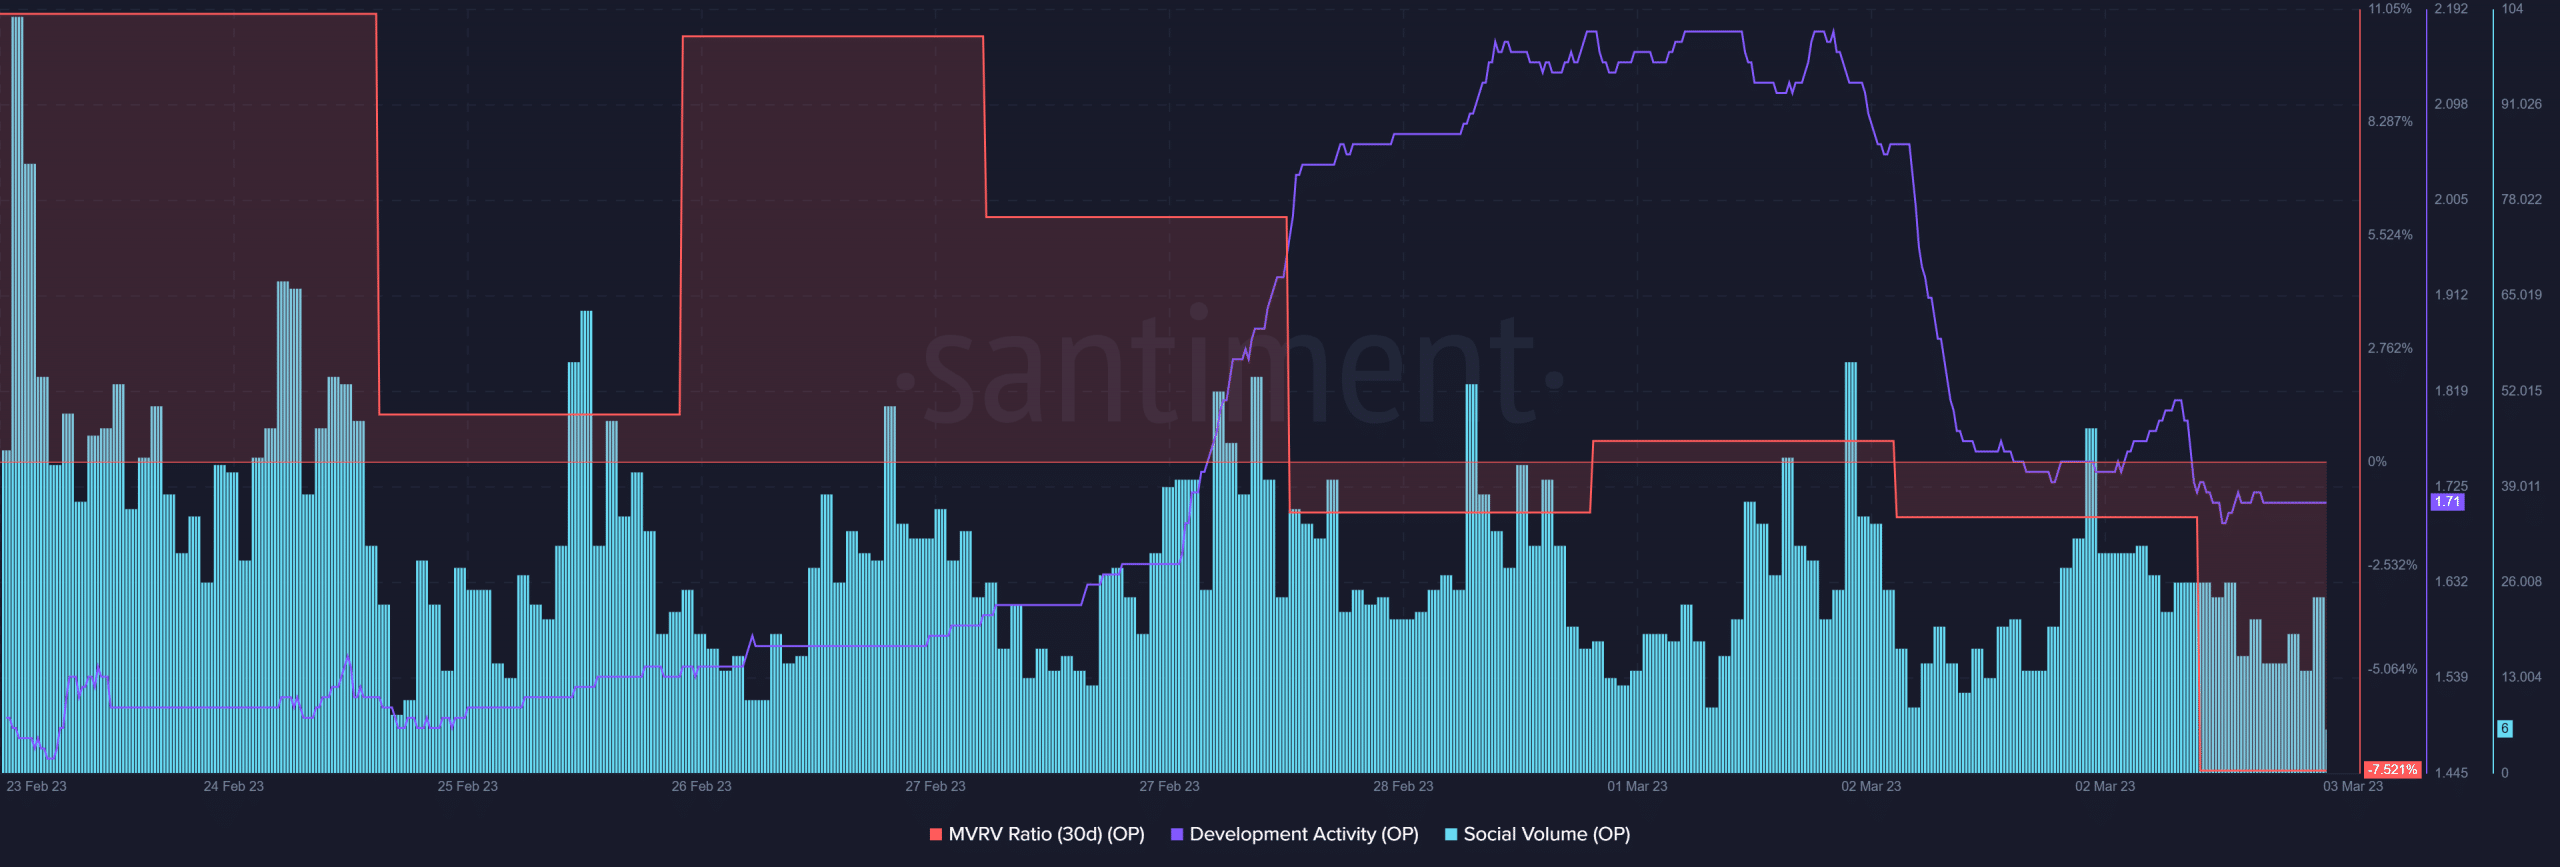
OP’s MVRV Ratio registered a sharp decline, which can be attributed to the fall in the token’s price. Another negative signal was that the network’s development activity went down in the last few days. OP’s performance on the social front also fell, which was evident from its social volume.
Realistic or not, here’s OP market cap in BTC‘s terms
Investors should be cautious
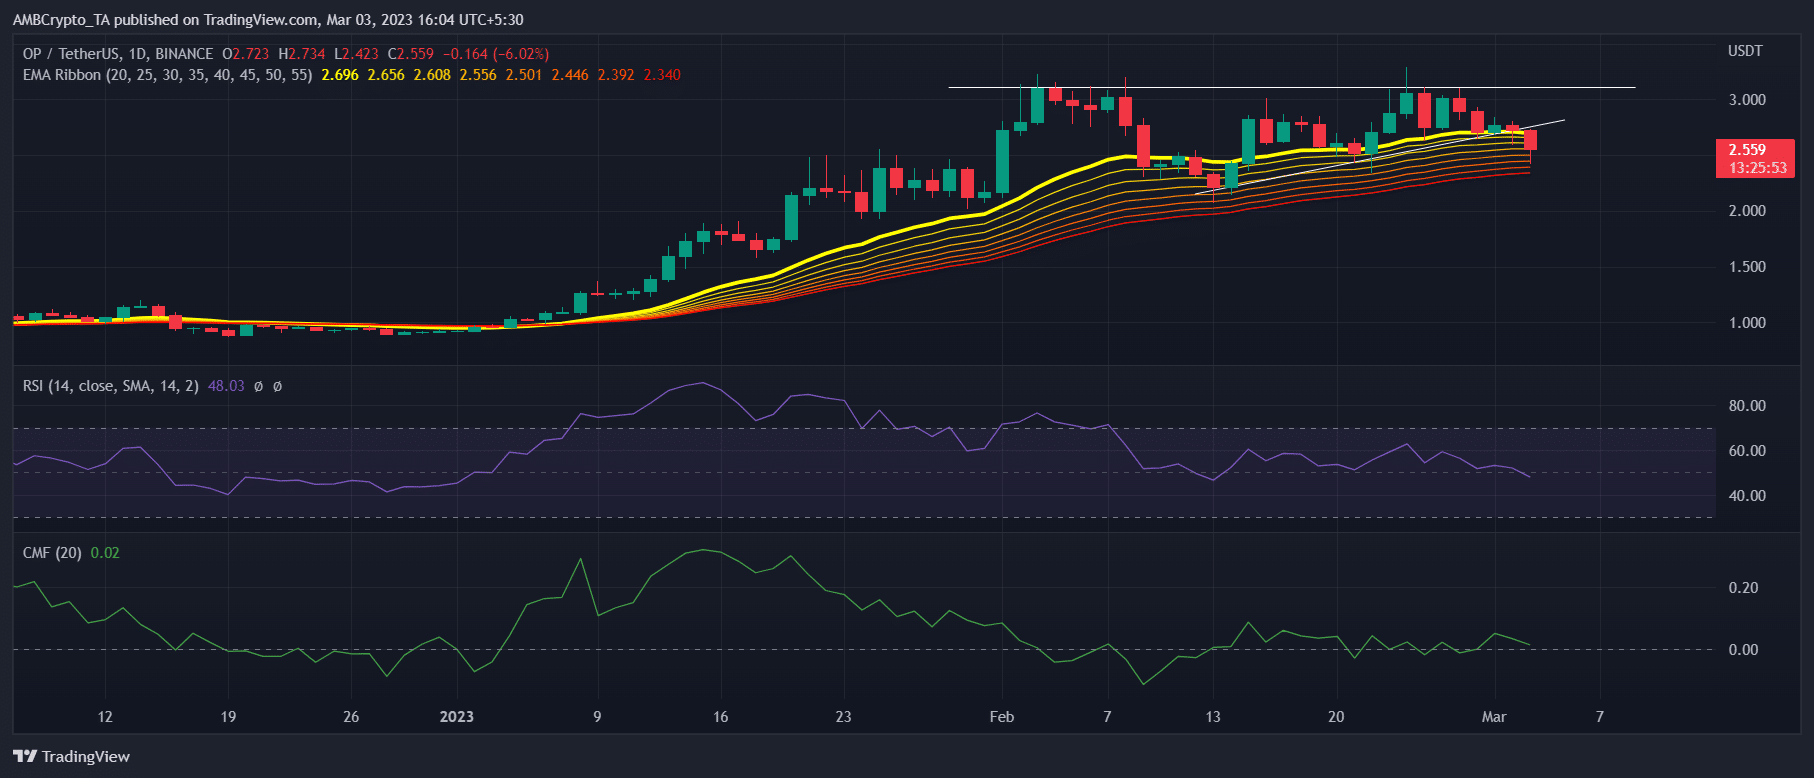
A look at OP’s daily chart revealed the formation of an ascending triangle pattern, which generally is a bullish signal. However, in this case, the opposite was true as OP’s price plummeted. Other market indicators also supported the bears.
For instance, the Relative Strength Index (RSI) registered a downtick. The same remained true for the Chaikin Money Flow (CMF), which was a bearish signal. Nonetheless, OP’s Exponential Moving Average (EMA) Ribbon was still bullish, as the 20-day EMA was comfortably above the 55-day EMA.
[ad_2]
Read More: ambcrypto.com

![Optimism [OP] overtakes Arbitrum, but what’s troubling investors? Optimism [OP] overtakes Arbitrum, but what’s troubling investors?](https://ambcrypto.com/wp-content/uploads/2023/03/OP-1000x600.jpg)


 Bitcoin
  Ethereum
  Tether
  XRP
XRP  Solana
  USDC
USDC  TRON
TRON  Dogecoin
  Lido Staked Ether
  Cardano
  Wrapped Bitcoin
  Hyperliquid
  Wrapped stETH
  Bitcoin Cash
  Sui
Sui  Chainlink
  LEO Token
  Stellar
  Avalanche
  Toncoin
  USDS
USDS  WhiteBIT Coin
  Shiba Inu
  WETH
WETH  Wrapped eETH
  Litecoin
  Binance Bridged USDT (BNB Smart Chain)
  Hedera
  Monero
  Ethena USDe
  Polkadot
  Bitget Token
  Coinbase Wrapped BTC
  Uniswap
  Pepe
Pepe  Pi Network
  Aave
Aave  Dai
Dai  Ethena Staked USDe
  OKB
OKB  Bittensor
  BlackRock USD Institutional Digital Liquidity Fund
  Aptos
Aptos  Cronos
  Internet Computer
  NEAR Protocol
  sUSDS
sUSDS  Jito Staked SOL
  Ethereum Classic