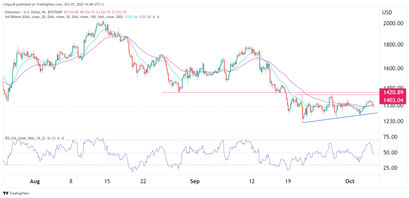
Ethereum price has been in a consolidation phase in the past few weeks as investors wait for the next catalyst after the merge. ETH dropped to a low of $1,324, which was lower than the September 27 high of $1,403. It is still about 35% below the highest point in August of this year.
Ethereum DeFi TVL and NFTs struggling
Ethereum is the biggest smart contract platform in the world. In the past decade, it has become the most useful network for building decentralized projects in industries like DeFi and non-fungible tokens (NFT). The theory is that ETH will do well when there are more developers and activity in its network.
Recently, however, a close look at Ethereum’s ecosystem shows that there are some challenges. For example, activity in its DeFi ecosystem has been in a freefall in the past few months. The total value locked (TVL) in its ecosystem peaked at more than $108 billion in December 2021.
Today, this value stands at about $31.7 billion. Maker, the biggest DeFi platform in its ecosystem has a TVL of over $7.7 billion. The other notable ones are Lido, Curve, Uniswap, Aave, and Convex Finance among others.

In my view, I believe that the number of DeFi platforms has peaked. Those that will thrive are the supermajors like Aave, Uniswap, Compound and Maker.
Learn more about how to buy Ethereum.
Meanwhile, Ethereum has also emerged as the most important player in the NFT industry. Some of the most popular NFT projects in Ethereum are Bored Ape Yacht Club, CloneX, Sorare, and CryptoPunks.
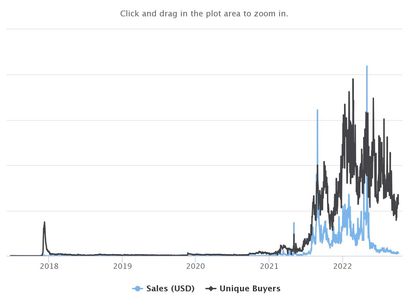
Unfortunately, the NFT industry is not doing well. Ethereum NFT sales rose to an all-time high in January at over $3.99 billion. In September, the volume dropped to about $320 million. As shown below, the trend has been in a downward trend.

So, what does all this mean for Ethereum prices? Historically, there have been a disconnect between ETH prices and the performance of NFTs and DeFi.
Ethereum price prediction

The four-hour chart shows that ETH price has been in a consolidation mode in the past few days. In this period, it has struggled to move above the important resistance at $1,403. It is also consolidating along the 25-day and 50-day moving averages while the Relative Strength Index (RSI) has pulled back.
Therefore, there are two potential scenarios based on historical standards. First, as we saw in November 2018, it could lead to major crash in the coming months. On the other hand, as it happened in March 2019, it could lead to a rally.
Read More: www.banklesstimes.com


 Bitcoin
  Ethereum
  XRP
XRP  Tether
  Solana
  Dogecoin
  USDC
USDC  Cardano
  Lido Staked Ether
  TRON
TRON  Avalanche
  Sui
Sui  Wrapped stETH
  Chainlink
  Toncoin
  Stellar
  Shiba Inu
  Wrapped Bitcoin
  Hedera
  Polkadot
  WETH
WETH  Bitcoin Cash
  Uniswap
  Pepe
Pepe  Hyperliquid
  LEO Token
  Litecoin
  Wrapped eETH
  NEAR Protocol
  Aptos
Aptos  Ethena USDe
  Internet Computer
  USDS
USDS  Aave
Aave  Render
  Mantle
  Cronos
  Bittensor
  POL (ex-MATIC)
  Ethereum Classic
  Artificial Superintelligence Alliance
  WhiteBIT Coin
  Virtuals Protocol
  Arbitrum
  MANTRA
  Tokenize Xchange
  Monero