Disclaimer: The information presented does not constitute financial, investment, trading, or other types of advice and is solely the writer’s opinion
- The technical indicators shed no light on the way forward for Ethereum
- With lower liquidity in the market, quick moves to trigger a mass of stop-loss orders before a short-term reversal are possible
Ethereum [ETH] witnessed very low volatility in the past few days. Since 20 December the price stuck to the $1,213 mark. This can be attributed to the holiday season. Yet, crypto markets never sleep, and ETH traders can look out for a move into an area of significance.
Read Ethereum’s [ETH] Price Prediction 2023-2024
For instance, $1,245 and $1,350 are two areas where the bulls will run into a large number of sellers. With Bitcoin also experiencing a muted period of sideways trading, what direction will the trend be when one emerges?
Ethereum reclaims mid-range but could see a dip once more to fill large orders
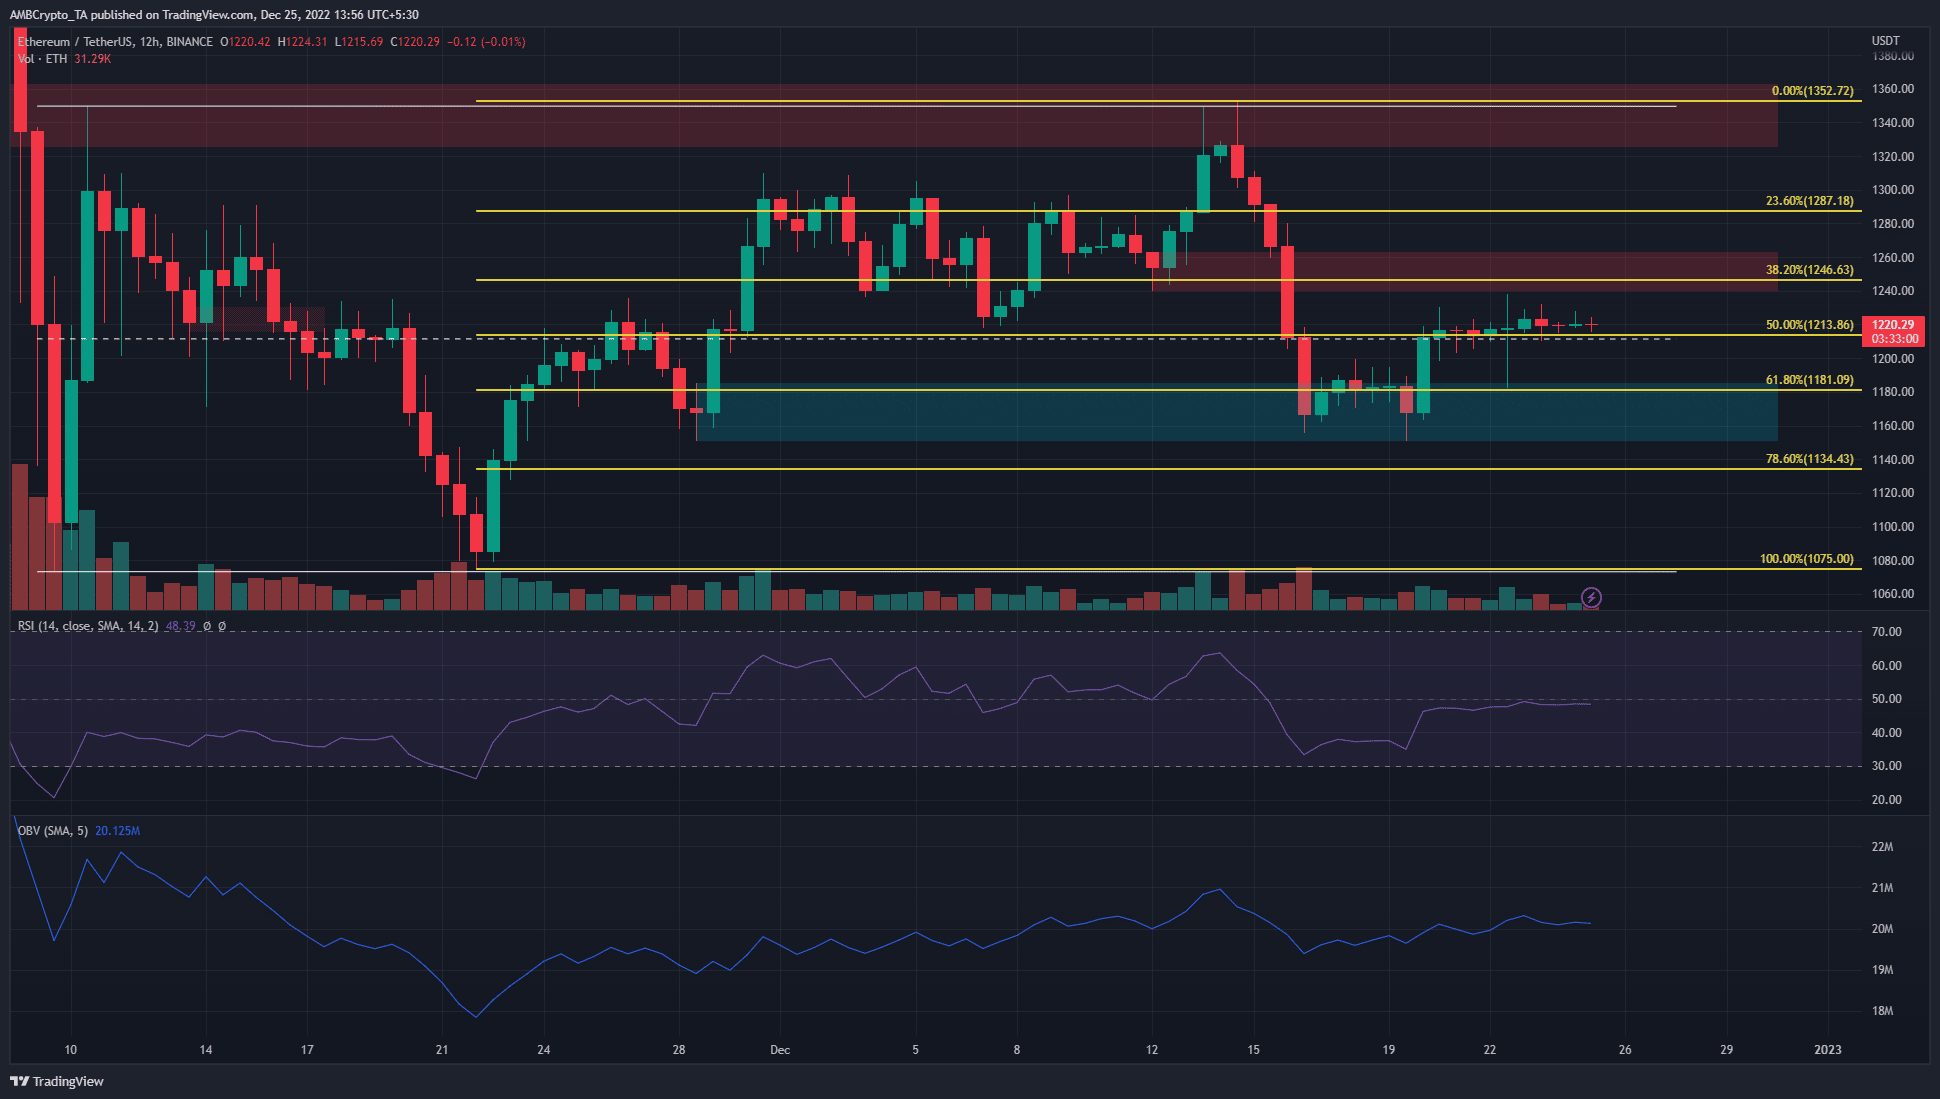
The market structure shifted to a bullish bias on lower timeframes when ETH rise from $1,160 and was able to rise above the $1,190 mark over the past week. However, the trading volume and the volatility have been quite low in recent days. This meant that the price could see a large deviation north or south in search of liquidity before a quick reversal.
This can go either way. ETH could rise to tag the H12 breaker at $1250 before plunging to $1160 once more. The reverse was also equally likely. Therefore a trader can wait for a trend to establish itself. The Relative Strength Index (RSI) has been close to the neutral 50 mark in recent days to indicate momentum favored neither the buyers nor the sellers.
Are your ETH holdings flashing green? Check the Profit Calculator
The Fibonacci retracement levels plotted were also important. In the next few days, a move above the 38.2% level or below the 61.8% level, followed by a retest, could serve as a trigger for a trader to target the respective extremes of the range (white). The range high is at $1,350 and the low is at $1,073.

Source: Santiment
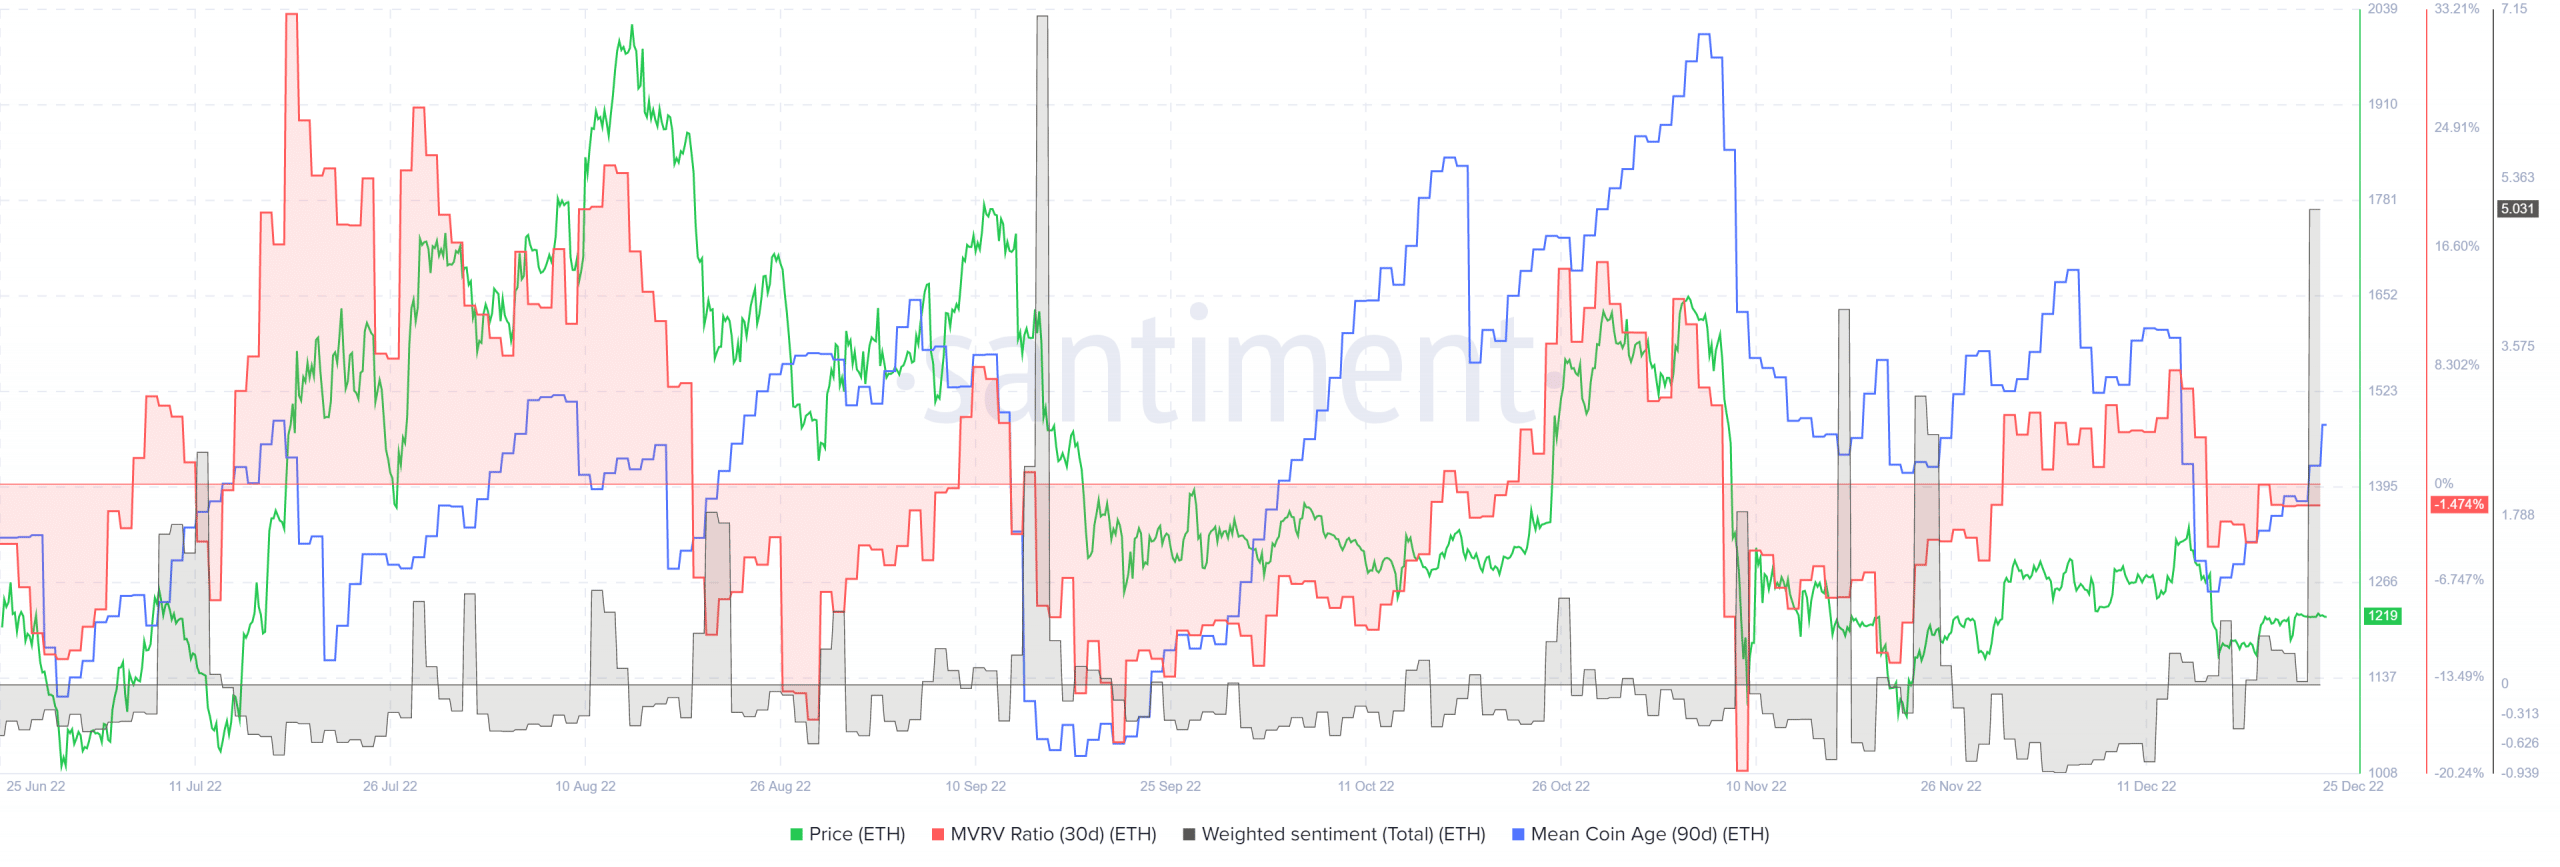
The Market Value to Realized Value (MVRV) ratio (30-day) fell into negative territory after Ethereum dumped from $1,340 to show that the asset was undervalued on shorter time scales. The 90-day mean coin age also took a hit at that time. Since then, the mean coin age metric has been on the rise. This showed some accumulation.
The weighted sentiment also shot higher recently, but there was no notable response from the price yet. In the past, a rising sentiment was not necessarily bullish for the price either. Instead, traders can be wary of a strong surge in the MVRV ratio as it can signal holders are ready to take profits.
Read More: news.google.com

![Ethereum [ETH] rises above $1,210 but is a year-end rally on the cards](https://ambcrypto.com/wp-content/uploads/2022/12/PP-2-ETH-cover-3-1000x600.jpg)


 Bitcoin
  Ethereum
  Tether
  XRP
XRP  Solana
  USDC
USDC  Dogecoin
  TRON
TRON  Cardano
  Lido Staked Ether
  Wrapped Bitcoin
  Hyperliquid
  Wrapped stETH
  Sui
Sui  Chainlink
  Avalanche
  Stellar
  LEO Token
  Bitcoin Cash
  Toncoin
  Shiba Inu
  Hedera
  USDS
USDS  WETH
WETH  Litecoin
  Wrapped eETH
  Monero
  Polkadot
  Binance Bridged USDT (BNB Smart Chain)
  Ethena USDe
  Bitget Token
  Pepe
Pepe  Pi Network
  Coinbase Wrapped BTC
  WhiteBIT Coin
  Aave
Aave  Uniswap
  Dai
Dai  Bittensor
  Ethena Staked USDe
  Aptos
Aptos  NEAR Protocol
  Cronos
  OKB
OKB  BlackRock USD Institutional Digital Liquidity Fund
  Internet Computer
  Jito Staked SOL
  Ethereum Classic
  Ondo
Ondo