- Exchange outflows hit a yearly high, suggesting bullish conviction.
- ETH’s price may find it challenging to surpass $3,255 in the short term.
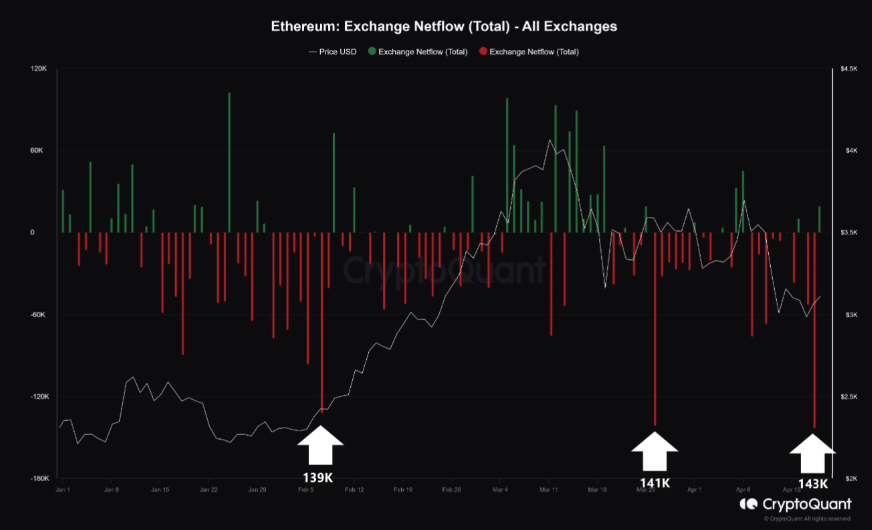
Unknown to many, Ethereum [ETH] registered its highest exchange outflows in 2024 on the 18th of April. On this date, market participants withdrew 143,000 ETH from platforms, per CryptoQuant.
Exchange outflow is a sign of unwillingness to sell, suggesting that the altcoin might not experience a severe capitulation. The last time ETH witnessed such was on the 7th of February and the 26th of March.
When the accumulation happened in February, ETH’s price was $2,372, and by the end of the month, the value of the cryptocurrency was $3,386.
But the outflow in March did not bring the same result as the price fell later. However, AMBCrypto found that there were reasons the outflow jumped.
Dogged holders keep the faith
One of them is the rising enthusiasm that the U.S. SEC would approve Ethereum ETFs by May. While some participants were convinced that approval would happen, some skeptics thought otherwise.
Burakkesmeci, an author on CryptoQuant, also seemed to agree with the viewpoint, mentioning that,
“We witnessed a significant amount of BTC leaving exchanges before the Bitcoin spot ETF approval. I can’t say the same is happening, but we should keep this possibility in mind.”
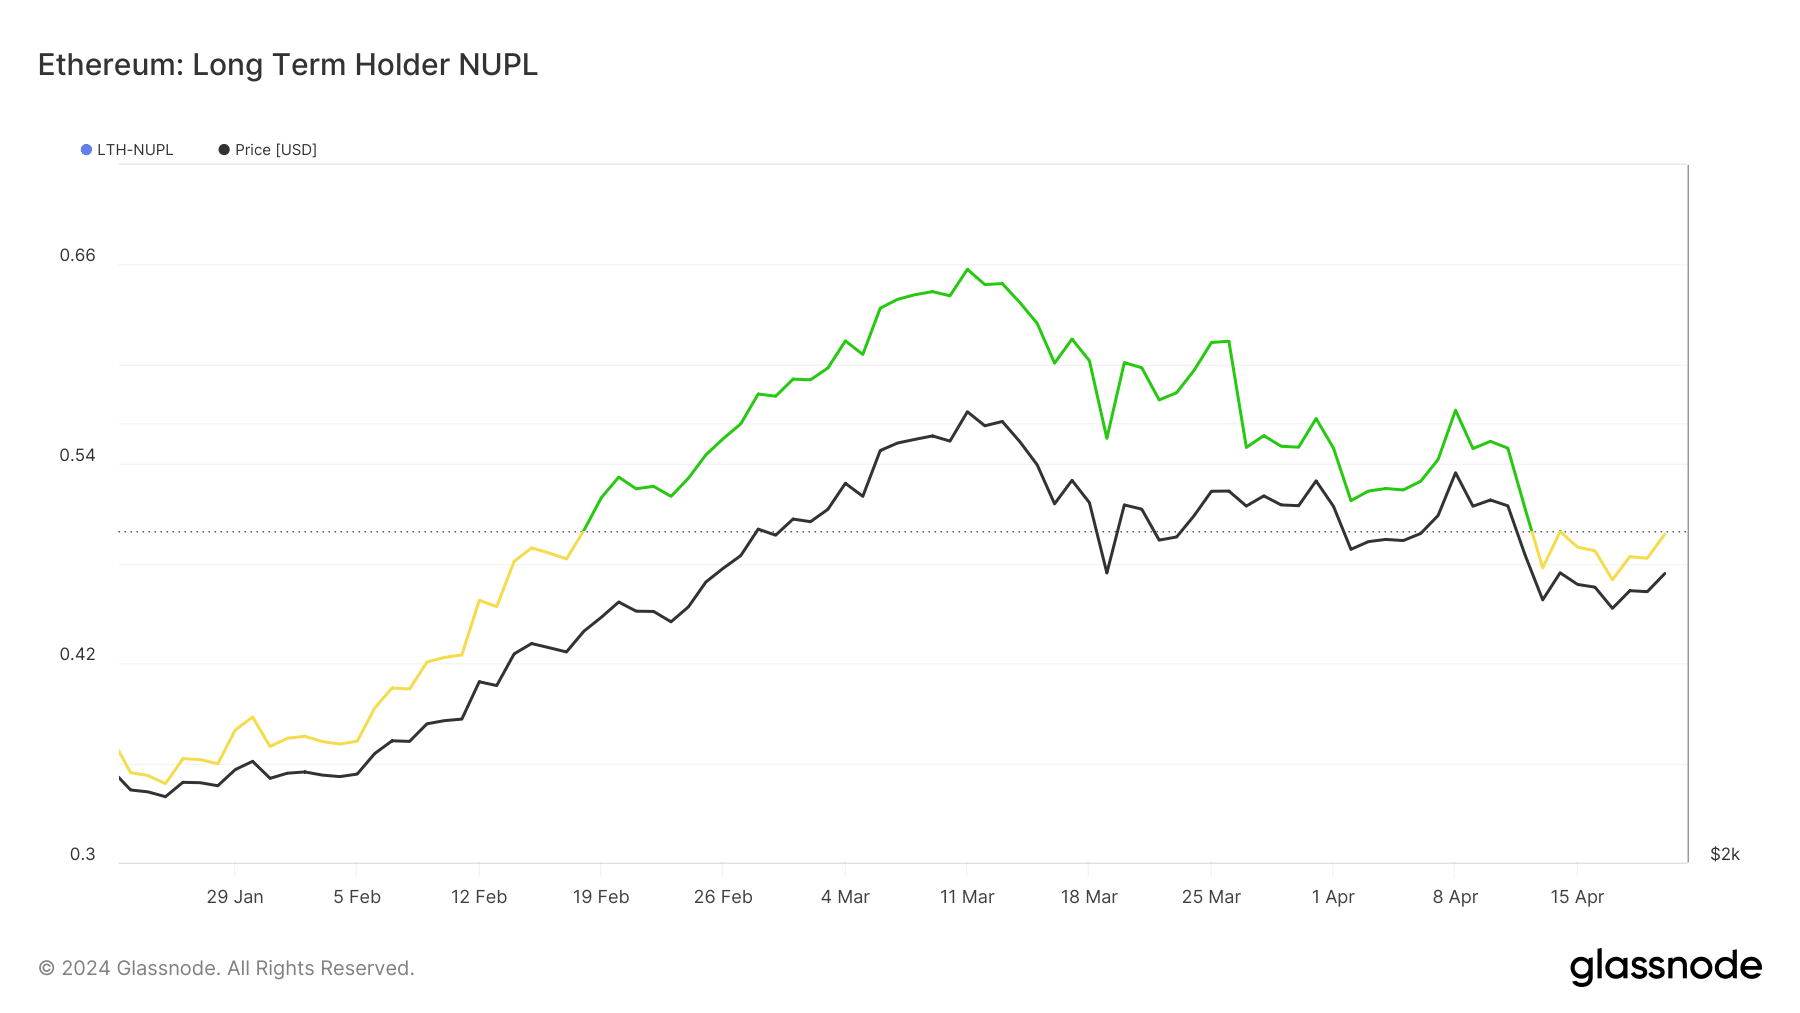
Another reason for the rise could be linked to the belief that ETH’s price is destined to outperform Bitcoin [BTC] this cycle. While this school of thought remains unfounded, AMBCrypto checked the LTH-NUPL.
LTH-NUPL is an acronym for Long Term Holder — Net Unrealized Profit/Loss. This metric shows the behavior of holders who have held the cryptocurrency for at least 155 days.
As of this writing, the LTH-NUPL was in the optimistic (yellow) region, despite moving closer to the euphoria side earlier. But that has not had a significant impact on the value.
ETH targets a lower low
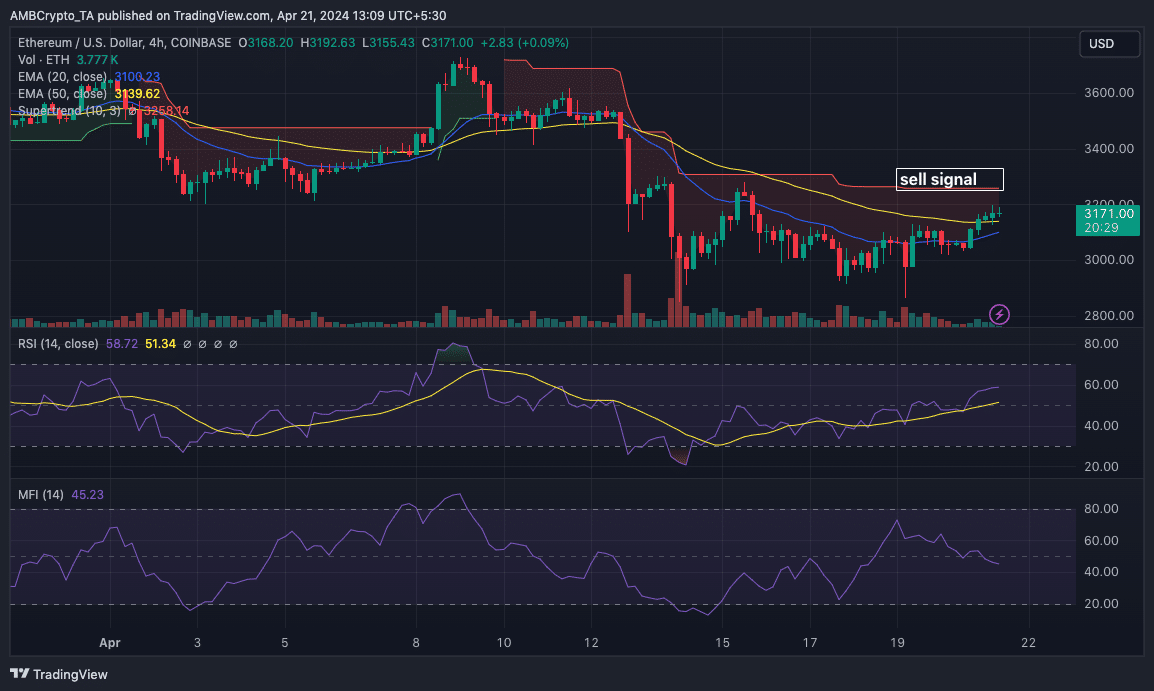
At press time, EHT changed hands at $3,175, representing a 3.67% increase in the last 24 hours. From a technical point of view, momentum around the token increased.
This was evident in the Relative Strength Index (RSI) whose reading was 58.64. Typically, this is supposed to bring about a further increase in the price action.
However, the Exponential Moving Average (EMA) showed a different signal. As of this writing, the 20 EMA (blue) was above the 50 EMA (yellow), indicating a bearish trend.
In addition, the Supertrend flashed a sell signal at $3,255. Therefore, if the cryptocurrency’s price keeps appreciating, it could face rejection at the aforementioned price.
Read Ethereum [ETH] Price Prediction 2024-2025
Like the Supertrend, the Money Flow Index (MFI) also displayed a bearish sign. With its downtrend, the MFI indicated that capital flowed out from the ETH market.
As such, the price could fail to break through the resistance at $3,500.
Read More: ambcrypto.com


 Bitcoin
  Ethereum
  Tether
  XRP
XRP  Solana
  USDC
USDC  Dogecoin
  TRON
TRON  Cardano
  Lido Staked Ether
  Wrapped Bitcoin
  Hyperliquid
  Sui
Sui  Wrapped stETH
  Chainlink
  Avalanche
  LEO Token
  Stellar
  Bitcoin Cash
  Toncoin
  Shiba Inu
  Hedera
  USDS
USDS  Litecoin
  WETH
WETH  Wrapped eETH
  Polkadot
  Monero
  Binance Bridged USDT (BNB Smart Chain)
  Ethena USDe
  Bitget Token
  Pepe
Pepe  Coinbase Wrapped BTC
  Pi Network
  WhiteBIT Coin
  Aave
Aave  Uniswap
  Dai
Dai  Bittensor
  Ethena Staked USDe
  Internet Computer
  OKB
OKB  Aptos
Aptos  NEAR Protocol
  Cronos
  BlackRock USD Institutional Digital Liquidity Fund
  Jito Staked SOL
  Ondo
Ondo  Ethereum Classic