Get the best data-driven crypto insights and analysis every week:
By: Matías Andrade
Dollar cost averaging (DCA) has become a key strategy for investors navigating the unpredictable realms of digital assets. This approach involves regularly investing a fixed amount, regardless of the current market cycle—a simple yet powerful strategy that contrasts starkly with the risk and stressful experience that investing in volatile assets can bring to novice investors. Because of this, DCA is often espoused as a pragmatic way to manage investment risks.
The increasing access to market data and a deeper understanding of these dynamics now allows for a more informed application of DCA. While it’s important not to rely too heavily on any single strategy in fluctuating markets, DCA provides a useful tool for investors looking to mitigate the impact of market volatility. In this week’s State of the Network, we aim to evaluate how dollar cost averaging has performed across the digital asset market, highlighting its role and effectiveness in today’s investment landscape.
Assessing any investment’s merit involves a careful analysis of its risk-adjusted returns, comparing various assets and strategies. With this in mind, we’ve crafted a methodology to benchmark DCA’s effectiveness across over 200 assets. By simulating a daily $10 investment starting on January 1st of 2019, 2021, and 2023, we can see how differing market phases influence outcomes. We can also evaluate how well DCA may serve as a stabilizing factor for those seeking to lessen the sting of market swings. Please note that we did not take into account transaction fees in this simplified model.
Return Performance Since 2019
As we can see in the chart below, DCA has performed relatively well, although perhaps not as well as we would have expected. We notice that although there are a few notable outliers, around 60% of the assets we tested are below the breakeven threshold value of the cash invested. For the period in question, this figure stands at $17,920.
Source: Coin Metrics Market Data
We removed the top 5% of the sample so that we can better appreciate the distribution of these returns—and we will consider these later on, but this should be indicative that investing in quality assets is equally important when doing DCA, even if the volatility of our portfolio is lower.
Return Performance Since 2021
Dollar cost averaging (DCA) is frequently recommended as a strategy for investors who might find it challenging to stay disciplined during the fervor of a bull market—a scenario where even experienced investors can incur losses amid the crypto market’s volatility. Most new investors make their first investment during a bull market, driven by heightened emotions and a pressing fear of missing out. DCA is often touted as a method to help temper these emotional responses and maintain a more balanced portfolio approach. Here we can examine some evidence to help set our expectations when using DCA in our investment toolkit.
Source: Coin Metrics Market Data
As we can see from the chart above, the majority of assets have not fully recovered to the point where daily DCA would prevent an investor from taking losses. This highlights the need for caution when considering entering the fray during a bull market, emphasizing that prudence does not always equate to protection from the market’s uncertainties.
Return Performance Since 2023
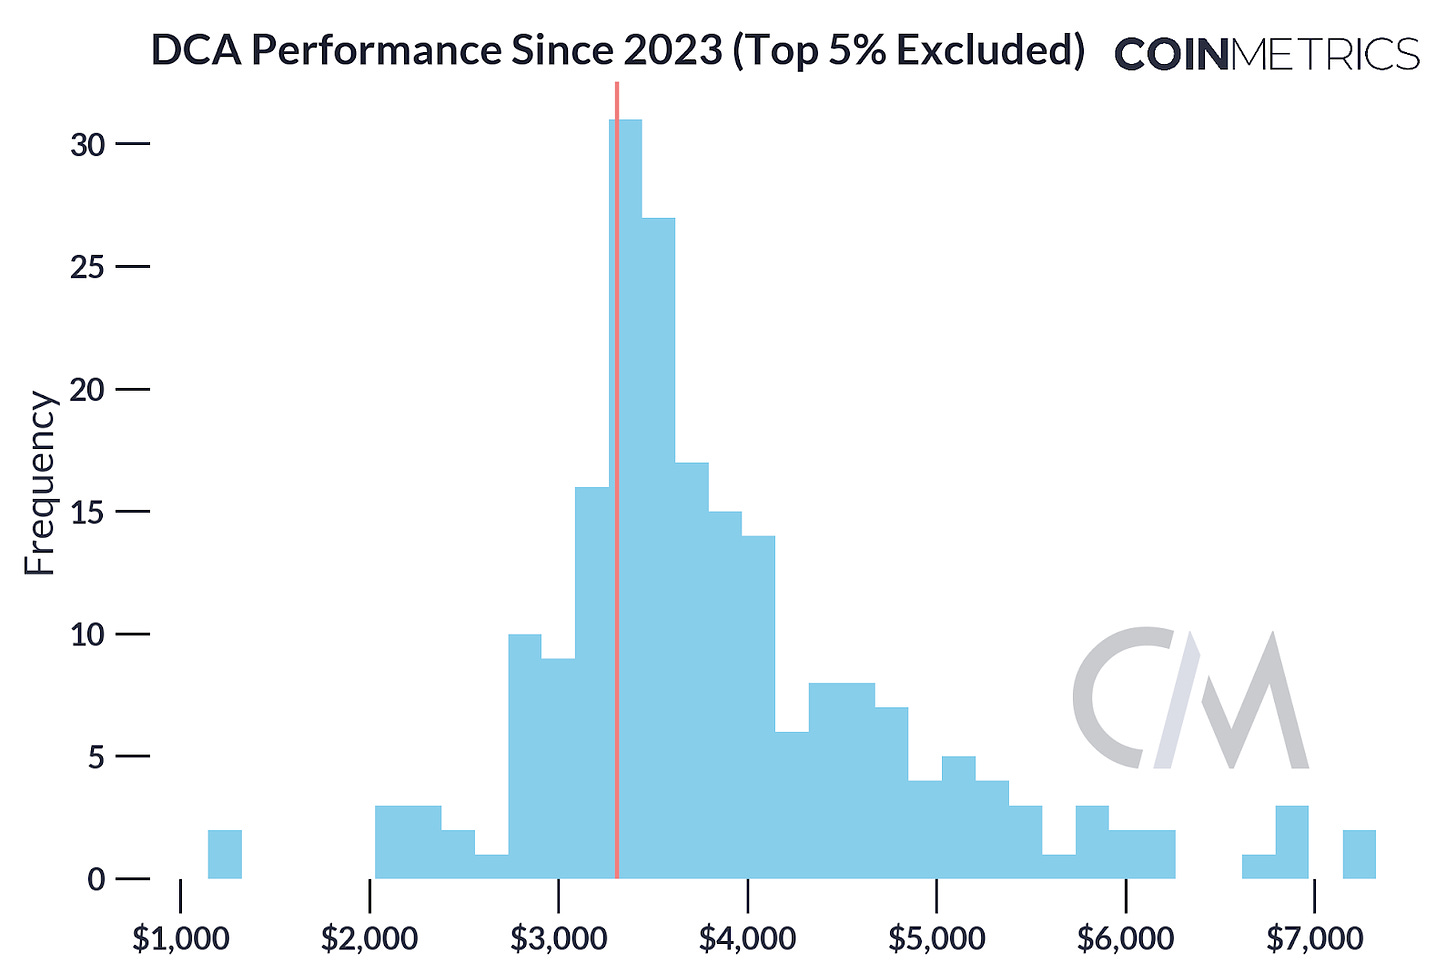
2023 has marked a rejuvenating phase for digital assets, hinting at the onset of a potential new bull market, especially with the anticipated Bitcoin halving event in 2024 drawing near. This upswing has buoyed prices across the board, a trend clearly reflected in the chart presented below. It also serves as a reminder that while some assets may experience substantial appreciation, others may see more conservative growth, with a significant number not reaching the breakeven point of their initial investment when excluding the top performers.
Source: Coin Metrics Market Data
Now that we understand the return distributions over previous time periods, we can focus on the return distribution since 2021 and hone in on DCA asset performance. First, let’s examine the top 15 assets sorted by market capitalization. The chart below demonstrates that even among highly-capitalized assets, DCA portfolios can lag behind their equivalent cash value. It’s evident that the top earners stand out—with SOL leading the way, closely followed by MATIC—having yielded returns of 252% and 184%, respectively, over the modeled DCA portfolios.
Source: Coin Metrics Market Data
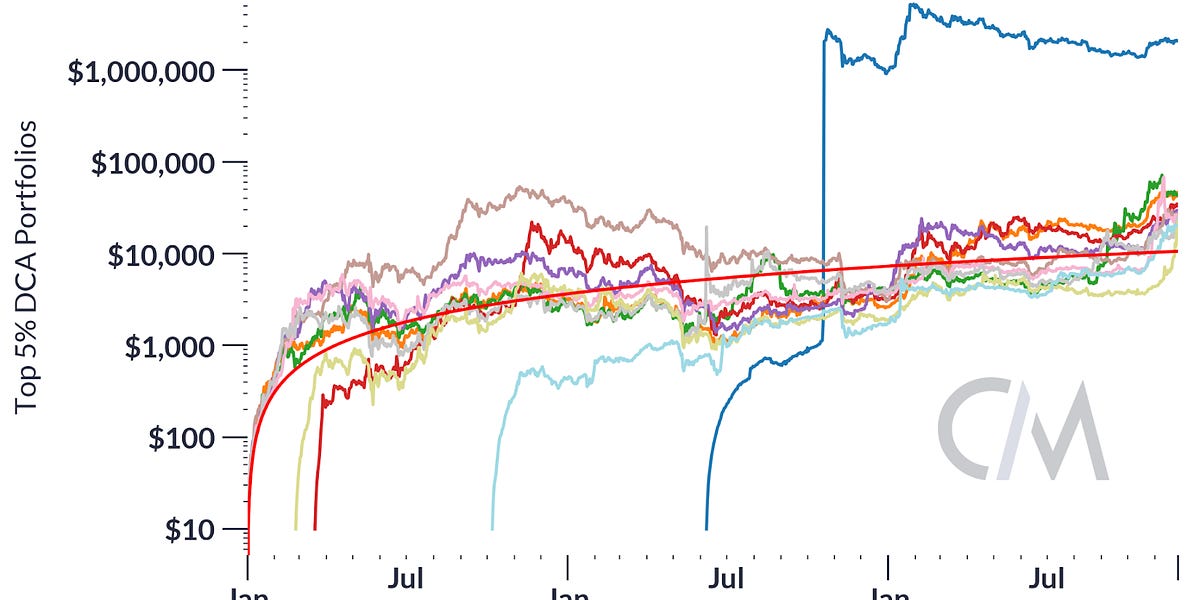
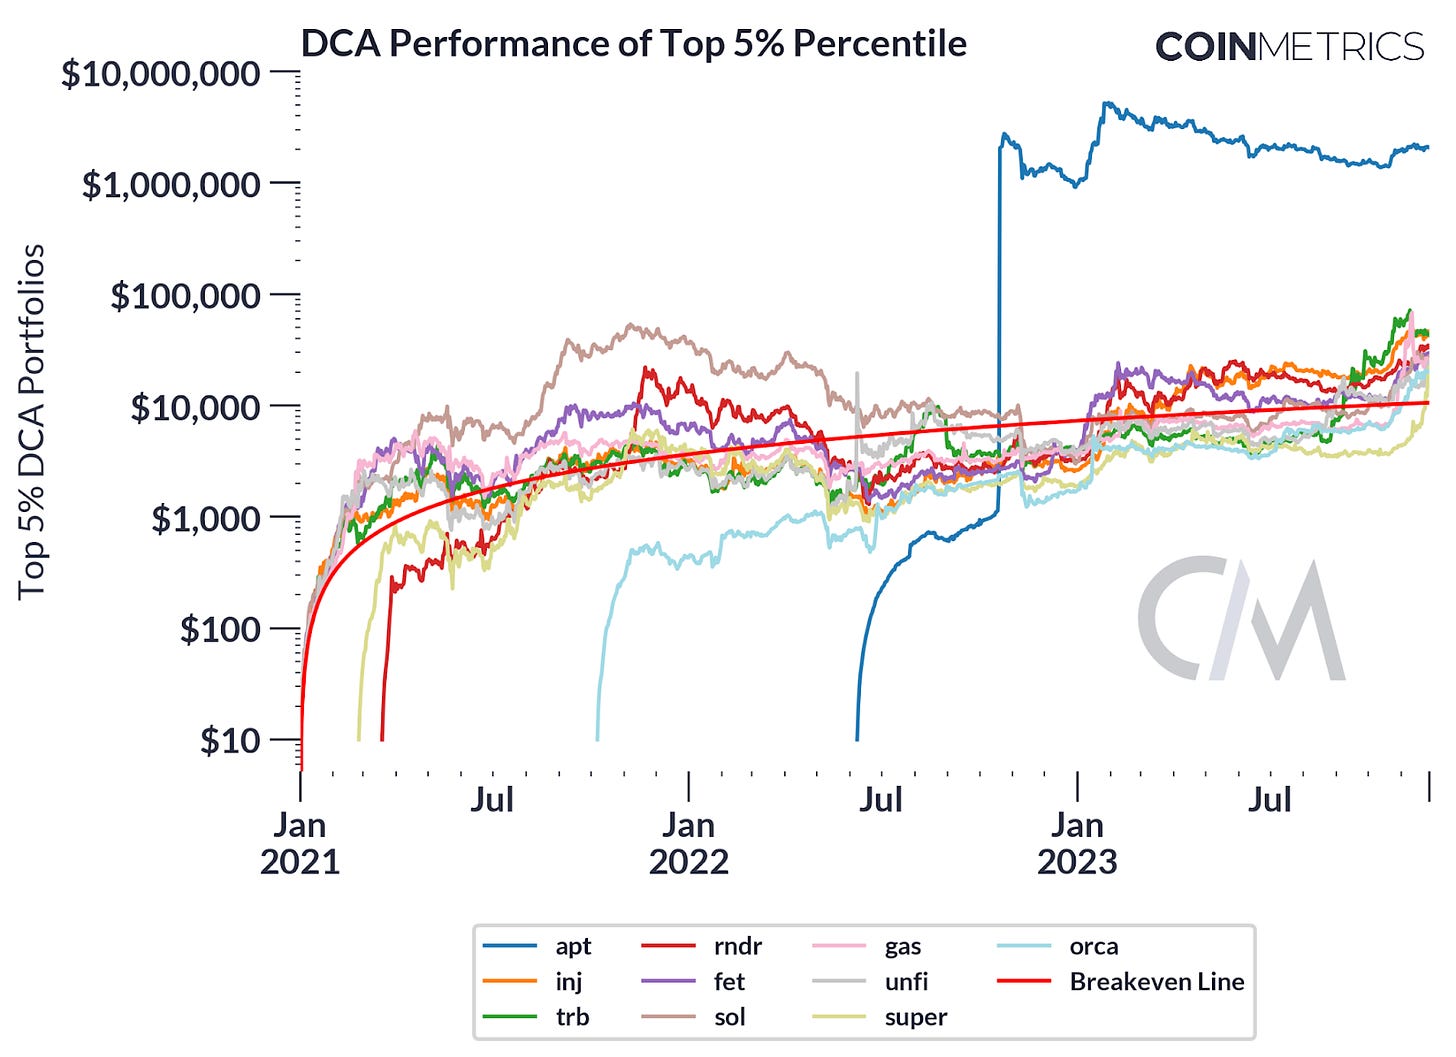
By sorting returns into percentiles, we gain a more granular understanding of which assets lead the pack and their relative performance. The accompanying graph illustrates the DCA performance of assets within the top 5% percentile plotted on a logarithmic axis, so that outlier performance is more easily discerned. Notably, a significant portion of these frontrunners are recent market entrants. Among them, APT stands out, trading at an impressive 194 times the cash equivalent of the investment, which is approximately $10.6K.
Source: Coin Metrics Market Data
Although the returns of the top portfolio seem enticing, it isn’t a realistic or complete view of the market, we should also look at the worst-performing assets. There are also a lot of new issues in the bottom 10th percentile, as demonstrated in the chart below, which should warn any investor thinking of taking a risk on a newly-issued token. Moreover, the volatility of these assets is so high that even a DCA method isn’t enough protection from such drastic swings. Although we saw a handful of assets go on a tear and seemingly hold up, there are many more that are briefly buoyed yet sink just as suddenly as they appeared.
Source: Coin Metrics Market Data
This chart is particularly valuable for investors as it emphasizes the need for thorough research and risk assessment when selecting assets for investment, especially when using a strategy like DCA. It also highlights the potential for volatility and the possibility of assets to underperform, even in a market that is generally perceived to be on the rise.
Drawdowns in crypto can be harsh, and the period from fall 2021 to fall 2022 was a tough one for holders of digital assets. However, bitcoin showcases the power of a DCA strategy with a somewhat surprising finding that if we begin the daily $10 DCA strategy at BTC’s all-time high price of $67.5K on November 8, 2021, the portfolio would be up about 33% today. The hypothetical portfolio would have exactly $7,500 invested and be worth over $10,000 today (again, ignoring trading fees on exchanges). After spending most of 2022 in the red, the portfolio actually would have turned positive in spring of this year.
Source: Coin Metrics Market Data
While the past success of this strategy need not carry forward, this example highlights the benefit of avoiding efforts to time the market in favor of time in the market—even when starting from the local top of a bull market.
The examination of dollar cost averaging (DCA) within the digital asset market has shown that DCA helps manage volatility but does not assure positive returns. The varied outcomes, particularly the underperformance of many assets despite a disciplined investment approach, emphasize the strategy’s limitations. DCA, while mitigating some risks, is not a one-size-fits-all solution, nor is it immune to the market’s complexities. In practice, investors need to incorporate trading fees and determine the best exchange(s) to execute their orders on.
DCA’s role in an investment strategy should be informed by rigorous research and an understanding of market conditions. As the digital asset landscape evolves, notably with events like the upcoming Bitcoin halving, it becomes increasingly important for investors to stay educated, agile, and vigilant in their investment decisions.
Source: Coin Metrics Network Data Pro
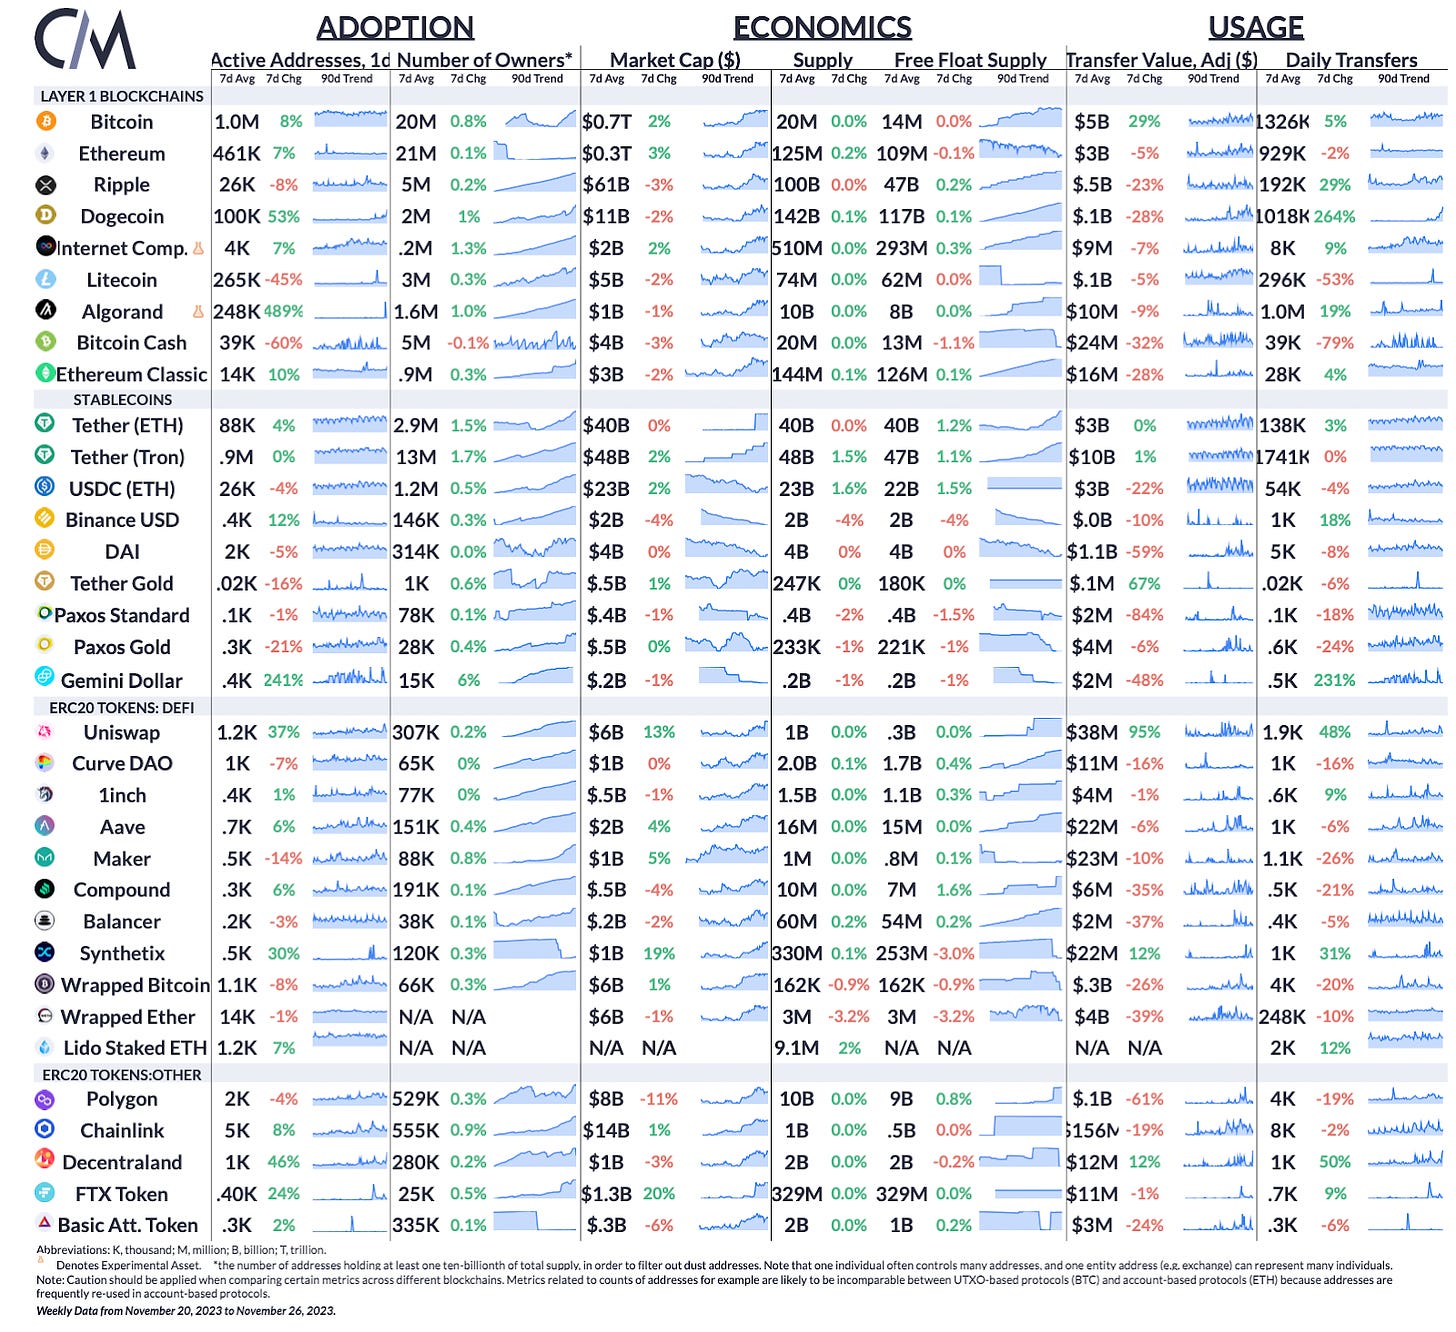
Bitcoin and Ethereum active addresses rose by 8% and 7% respectively over the week. Active addresses on Tether (ETH) grew by 4%, while USDC experienced a 4% drop in active addresses. USDC reversed its supply fall, with its market cap growing 1.6% week-over-week. The market cap of Tether also hit a new all-time high of ~$87B.
This week’s updates from the Coin Metrics team:
-
Follow Coin Metrics’ State of the Market newsletter which contextualizes the week’s crypto market movements with concise commentary from the Coin Metrics team, rich visuals, and timely data.
-
We recently released a beta version of our tagging data, check out the details of the release here.
As always, if you have any feedback or requests please let us know here.
Coin Metrics’ State of the Network, is an unbiased, weekly view of the crypto market informed by our own network (on-chain) and market data.
If you’d like to get State of the Network in your inbox, please subscribe here. You can see previous issues of State of the Network here.
© 2023 Coin Metrics Inc. All rights reserved. Redistribution is not permitted without consent. This newsletter does not constitute investment advice and is for informational purposes only and you should not make an investment decision on the basis of this information. The newsletter is provided “as is” and Coin Metrics will not be liable for any loss or damage resulting from information obtained from the newsletter.
Read More: coinmetrics.substack.com


 Bitcoin
  Ethereum
  Tether
  XRP
XRP  Solana
  USDC
USDC  Dogecoin
  Cardano
  TRON
TRON  Lido Staked Ether
  Wrapped Bitcoin
  LEO Token
  Toncoin
  Chainlink
  Stellar
  USDS
USDS  Wrapped stETH
  Avalanche
  Sui
Sui  Shiba Inu
  Hedera
  Litecoin
  Polkadot
  MANTRA
  Bitcoin Cash
  Bitget Token
  Ethena USDe
  WETH
WETH  Binance Bridged USDT (BNB Smart Chain)
  Wrapped eETH
  Hyperliquid
  Monero
  WhiteBIT Coin
  Pi Network
  Uniswap
  Dai
Dai  Pepe
Pepe  sUSDS
sUSDS  NEAR Protocol
  Aptos
Aptos  OKB
OKB  Coinbase Wrapped BTC
  Gate
Gate  Tokenize Xchange
  Ondo
Ondo  Cronos
  Mantle
  Ethereum Classic
  Internet Computer