Even as an analyst, I still have a lot to learn in crypto-assets (virtual currencies), a still-new asset class. I am particularly interested in connecting my experience in traditional finance (TradFi) with crypto assets.
I used to be an equity research analyst. Specializes in valuation (corporate valuation). I’ve always believed that doing the “right” evaluation is above all else, and I’ve been trying to find answers to two related questions:
- What is your organization worth?
- Are they trading above that amount? Are they trading low?
If a company is trading below its expected market value, we rate it as ‘Buy’. If it was trading high, I would frankly find another company to replace it rather than give it a “sell” rating. There are many dynamics in stock research that lead to such decisions, and I may write about them another time.
I used a combination of fundamentals and technical analysis, using both absolute and relative value techniques. An absolute valuation is based on the level of cash flow a company generates. Relative valuation, on the other hand, is based on value relative to similar organizations or the previous state of the same company.
Unlike corporations, Bitcoin (BTC) and many other crypto assets do not generate cash flow on which to base fundamental analysis.
But Bitcoin is not a company. Bitcoin is a peer-to-peer currency system that allows value to move from one user to another without third-party verification. People see value in it, so you should try to evaluate it.
Some see bitcoin as a hedge against the depreciation of fiat currency and against the policies of incompetent central banks, given its limited supply. I think I’m both, and I have some assets invested in as a viable asset class.
Bitcoin version PER
In the world of stocks, the price-to-earnings ratio (PER) is commonly used as a measure of relative value. There are better valuation techniques out there, but it’s a straightforward comparison that shows the ratio of a company’s earnings to its share price.
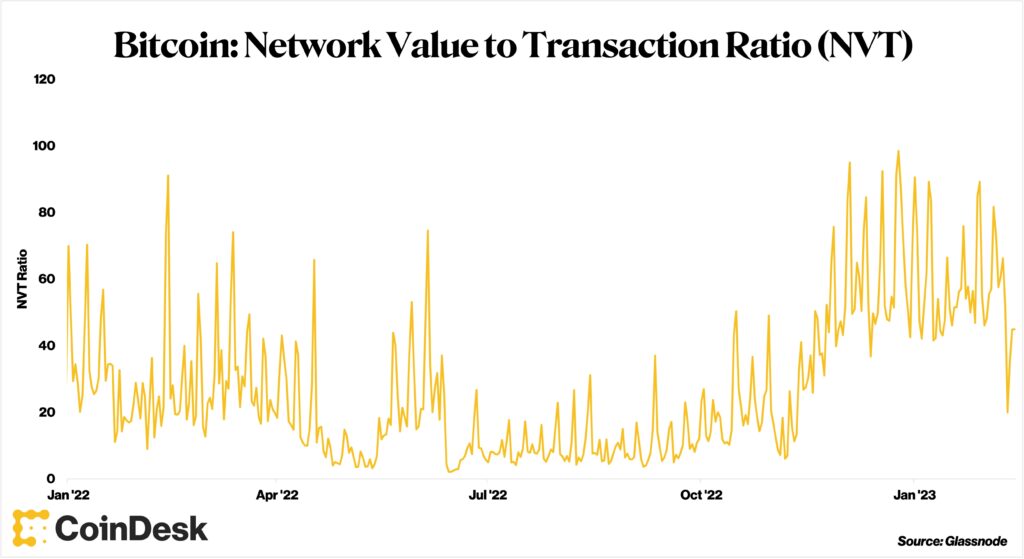
The cryptocurrency version of PER is the Network Value to Transaction (NVT). The metric, devised by crypto analyst Willy Woo, measures the relationship between market capitalization and value moved by the network (=trading volume).
Transaction volume is like revenue, representing how much bitcoin has been moved from one address to another.
Source: Glassnode
In my opinion, for NVT to equate to PER, people need to see some value in both.
When it comes to companies (and P/E), shareholders see value in earnings. For BTC (and NVT), it’s the ability to store value in crypto assets, which I think of as the space on the blockchain. As the demand for that space grows, so does Bitcoin’s value. If convincing, NVT would be worthy of inclusion in the analytical framework.
A high NVT indicates that investors see high value in Bitcoin. Low NVT suggests the opposite, making crypto assets attractive to investors looking to buy assets at bargain prices.
Expensive? Is it cheap?
But how many numbers are high and low? When do such numbers appear? Given the short history of crypto assets, what may have seemed expensive at one point in time may not be so at another. It is also meaningful to consider where we stand relative to past history. And it also makes sense to look only at certain times.
The highest NVT I have ever found was 448.15 on August 29, 2010. Is this too expensive?
At that time, the Bitcoin price was about 6 cents (about 8 yen), and the current price is about 22,000 dollars (about 2.95 million yen). It seems pretty pointless to compare.
Let’s ignore all data before 2014. The highest NVT value is 98.52, which is more reasonable. The all-time low NVT was 0.22 on January 24, 2016, when the price of Bitcoin was $403. The average NVT for the period covered was 24, but I think that number is also significant.
Bitcoin’s current NVT is 44.89, 82% higher than its average since 2014. However, it is 20% lower than the 30-, 60-, and 90-day averages.
It makes sense to me that the average premium for new technologies like the Bitcoin blockchain and new assets like Bitcoin will increase over time. It also makes sense that, as the data shows, the gap between the extremes of high and low is getting narrower and narrower.
Ultimately, how you perceive the current NVT level will depend on what you are basing it on. If you look at bitcoin’s entire history, it might seem overpriced. But on a narrower time horizon, Bitcoin may be trading at an attractive price right now.
|Translation and editing: Akiko Yamaguchi, Takayuki Masuda
|Image: Shutterstock
|Original: Crypto Long & Short: Sorting Out Bitcoin’s P/E Ratio
Read More: bitcoinwarrior.net


 XSGD
XSGD  zkRace
  Vertex
  Numbers Protocol
  GATSBY
  GOUT
GOUT  ShapeShift FOX
  BILLION•DOLLAR•CAT (Runes)
  Giko Cat
  OctaSpace
  XPR Network
  Clore.ai
  Kishu Inu
  GameFi.org
  Hoppy
Hoppy  XT.com
  BIM
BIM  Maya Protocol
  PAID
PAID  cUSDC
cUSDC  Sturdy
  Binance-Peg DAI
  Snowbank
  Shardus
  Everscale
  Boson Protocol
  UFO Token
  Rifampicin
  DexTools
  TROY
TROY  Step Finance
  Solv Protocol SolvBTC.CORE
  GoGoPool ggAVAX
  Ethervista
  A Hunters Dream
  Streamr
  Synternet
  Propchain
  FLOCK
FLOCK  Saros
Saros  AXOL
AXOL  district0x
  Tranchess
  cBAT
cBAT  CargoX
  Rich Quack
  Biswap