Get the best data-driven crypto insights and analysis every week:
By: Kyle Waters and Matías Andrade Cabieses
In the nascent digital assets industry, Coinbase stands out with a legacy tracing back to 2012, with its roots as an early Bitcoin-focused platform which passed through the renowned startup incubator, Y Combinator. More than a decade on, Coinbase is today best known as an exchange to buy and sell crypto assets, and has maintained its position as the top US-based exchange by volume.
But recent developments prove Coinbase is working to diversify its reach beyond a trading venue, stretching out across the full stack of blockchain technology, from wallet infrastructure to staking services and on-chain scaling solutions. Last month’s launch of Coinbase’s layer-2 (L2) rollup Base—a low-cost, Ethereum-compatible smart contract environment—stands as a perfect example. Through the lens of Coin Metrics, a wealth of market and on-chain data allows us to build new insights into Coinbase’s market stance. In this week’s issue of State of the Network, we highlight pivotal data underscoring Coinbase’s current market position.
Unsurprisingly, one of Coinbase’s most important sources of revenue is based on trading activity on their exchange. Looking at the last quarterly earnings report in which Coinbase reported total revenue of $707M, spot volume remained the largest component of the business, with transaction volume on exchange constituting $327M. In 2022, a share of over 77% of their total revenue came from trading fees, down from 92% in 2021. For these reasons, taking a close look at spot trading volume can be very helpful to understand Coinbase’s health and how their revenues are holding up compared with previous years.
Sources: Coin Metrics Market Data Feed & Google Finance
As we can see from the chart above, Coinbase’s stock price ($COIN) has tracked spot volume very closely since the company’s April 2021 IPO. Although we can expect this correlation to weaken over time as Coinbase’s revenues detach purely from trading fees, it should remain a useful gauge of how their business is performing. A difficult risk-off environment for tech stocks coupled with a challenging past year for digital assets has led to a large slump in Coinbase’s share price from its IPO at over $300 a share. However, 2023 has delivered a respectable rebound, with the stock up 145% YTD.
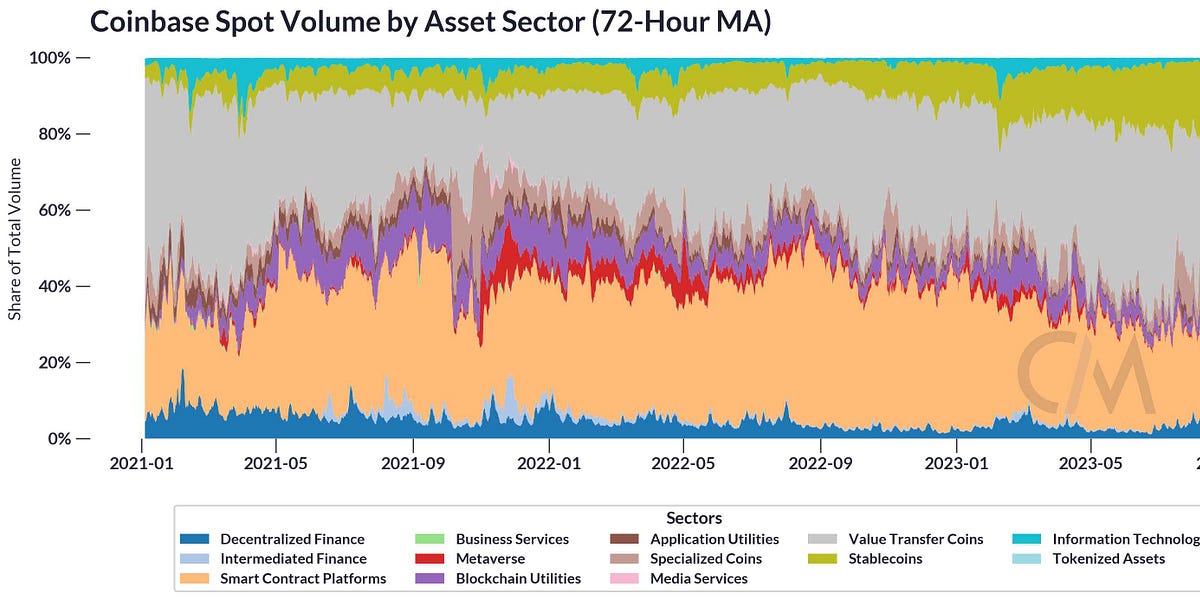
We can further examine spot volume trends at Coinbase by looking at the distribution of volume broken down using Coin Metrics’ datonomy™, which serves as a digital asset taxonomy and categorizes assets based on their functionality. On this basis, we took Coinbase’s traded volume and measured the proportion attributed to each different asset sector as illustrated below. One noticeable fact is that by far the two most important asset sectors consist of Value Transfer Coins and Smart Contract Platforms, which include Bitcoin and Ethereum, respectively. Another noticeable trend is a greater proportion of trading volume for stablecoins. Since Coinbase trading pairs are generally denominated in USD this is indicative of a greater demand for stablecoins as a share of overall digital assets. Looking at last week’s issue of our State of the Market report, a weekly look into market data and on-chain trends, shows that the share of volume derived from trading in Tether (USDT) has increased as of late on Coinbase.
Source: Coin Metrics Market Data
As Coinbase’s exchange business has grown and more assets have been added to be traded, the relative importance of these assets has changed over time. As we can see in the previous chart, towards the end of 2021 and into 2022, the Metaverse asset sector became increasingly popular as Facebook rebranded into Meta and a big hype wave caught hold of the market. As we can see in the chart below, Coinbase now trades over 600 asset pairs on the exchange.
Source: Coin Metrics Market Data
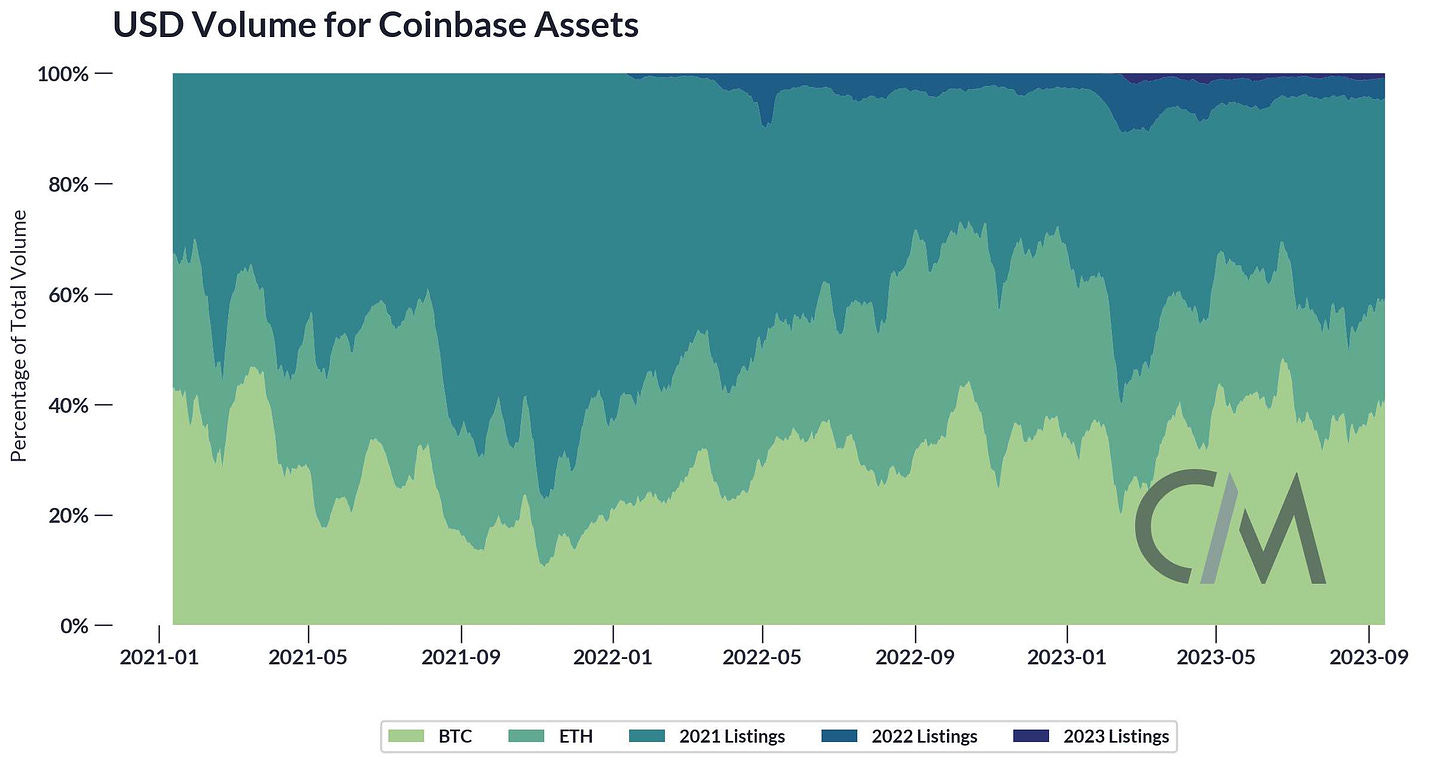
However, at least as far as exchange volumes go, earlier assets remain the most popular, with an overwhelming majority of the volume traded being attributed to assets that were listed earlier in Coinbase’s history, along with BTC and ETH.
Source: Coin Metrics Market Data
This shows that simply adding new assets isn’t a guaranteed way of generating trading fee revenues, even if new assets tend to trade heavily right after they are listed on an important exchange like Coinbase. It turns out there is no magic bullet when it comes to generating trading fee revenues. Further, the impending decisions around a spot ETF in the US may have significant implications for the exchange: would-be buyers of BTC may prefer to purchase the ETF as an easier (and possibly cheaper and tax-efficient) way of gaining exposure. It’s a complicated equation though, because Coinbase may also stand to benefit from an ETF launch as the custodian for the BTC held in the fund.
Another important consideration is Coinbase’s position within the US market for crypto exchanges, which has increased lately amid Binance US’s ongoing contraction in trading volumes. But trading fees aside, Coinbase has been diversifying into different businesses across the crypto ecosystem, including staking and layer-2 networks, as we will see below.
We can go beyond “off-chain” market data and track Coinbase’s many activities on-chain. As an exchange, Coinbase continually handles deposits and withdrawals of crypto assets from its users. However, from the vantage point of an on-chain data analyst, Coinbase has historically proven to be a difficult entity to examine as it has taken sophisticated actions to secure user funds across many accounts. This can make tracking down wallet addresses difficult, especially on Bitcoin where change outputs muddy the picture. To be sure, the exchange is audited as a public company in the United States. But the complete set of its wallet addresses is not widely publicized. However, on certain blockchains like Ethereum, where account re-use is more common, we can examine trends more easily.
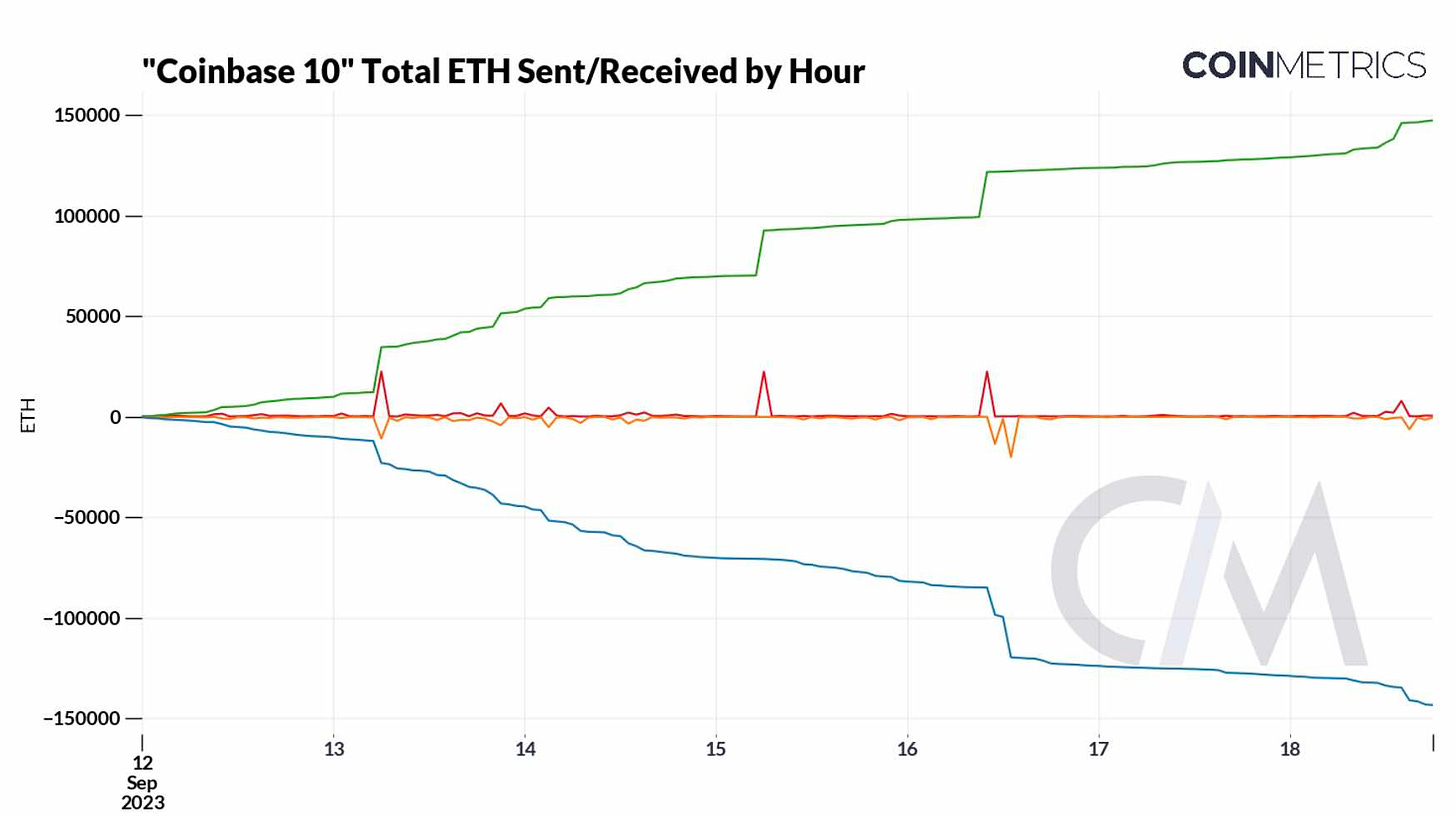
Using an early version of Coin Metrics’ tagged addresses, we identified a particularly active address that appears to be currently handling a large portion of activity for Coinbase—labeled “Coinbase 10” on Etherscan. Below, we plotted the hourly change in ETH sent and received by this account over the last week. With close to 150K ETH sent and received,, this account is one of the top accounts by ETH volume in that same time period.
This is just a small anecdote to help corroborate the exchange’s significant presence in the ecosystem. Tracking exchange activity over a longer time frame may help shed light on more trends such as user behavior and their favored assets. As Coinbase has expanded beyond a simple exchange into staking and as an L2 rollup operator, we are presented with new opportunities to explore this activity on-chain.
Staking is a fundamental component of Proof-of-Stake blockchains and an increasingly bigger component of Coinbase’s business. After Ethereum’s move to PoS with The Merge, the staking landscape has grown considerably and Coinbase has been involved in this burgeoning space. Through its liquid staking token, Coinbase Wrapped Staked ETH (cbETH), Coinbase allows ETH holders to lock their assets in a smart contract, receiving cbETH as a liquid representation of their stake. Unlike Lido’s stETH, which uses a aToken model, cbETH employs a cToken model based on a floating conversion rate, thus representing ownership of the underlying plus rewards accrued on the principal amount (minus penalties like slashing). This ensures cbETH is ERC-20 compliant and widely compatible with dApps, though not at a 1:1 ratio.
Despite facing SEC scrutiny earlier this year via a Wells notice, Coinbase’s staking service has proven resilient. Following a temporary dip after withdrawals were enabled, cbETH’s supply rose to under 1.3 million, primarily driven by higher staked balances—including a significant increase in institutional staking adoption after the Shapella upgrade. Despite not being the largest liquid staking provider in terms of market share, Coinbase charges a relatively higher staking commission of 25%, which contributed 13% to net revenue from “Blockchain Rewards” and 4% of reward adjusted net revenue as of Q2–2023 (after accounting for rewards passed to customers).
Coinbase has recently ventured into native on-chain solutions, notably with the introduction of its Ethereum layer-2 (L2) network, named Base, which went live just last month after being announced earlier this year. A rollup is effectively a separate blockchain, but with some essential added benefits and trade offs. Broadly, rollups help create the conditions for cheaper transaction fees by moving computation off-chain, but also with weaker guarantees of decentralization. The Base network was built on the open source OP Stack, the same stack that powers the other Ethereum L2, Optimism.
Putting technical details aside, there are a number of important considerations stemming from the launch of Base. First, Base introduces a low-cost and familiar environment for Ethereum smart contract developers to build applications, and an easy on and off ramp from the Coinbase exchange to move funds to and from Base. Base may also help expand USDC adoption, and subsequently interest income, which has grown considerably for Coinbase with rising rates. Finally, Base also represents a new potential revenue stream in its own right, which came up in the most recent earnings call:
“So, how will we monetize it [Base]? Well, the short answer is that Base will be monetized through what are called sequencer fees. These are—sequencer fees can be earned when any transaction is executed on Base and basically, Coinbase can run one of these sequencers as others can over time. Now indirectly, it helps us monetize as well because it helps us grow the size of the pit. It helps us grow the ecosystem.”
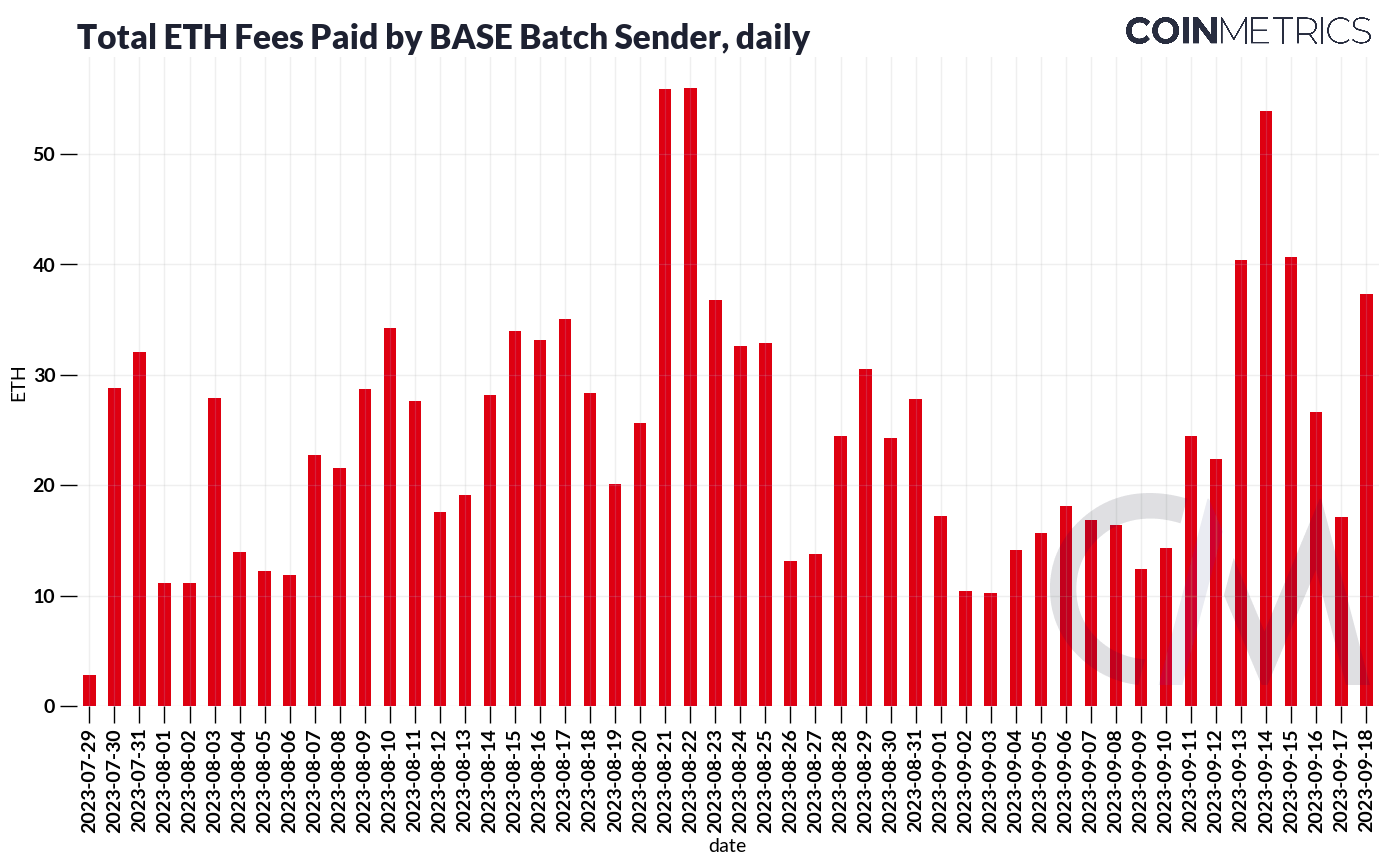
It’s important to understand the economics of a rollup operator, which consists of costs (mainly in the form of posting data on L1) and revenues from transaction/sequencer fees. We can track the Base Batch Sender address which sends a batch of compressed transactions from Base to Ethereum. This ensures data availability and integrity that transactions were executed as expected on Base. But posting large amounts of data to Ethereum is expensive, and as we can see below, this address has consumed a considerable amount of gas so far, at times almost hitting over 1% of all ETH fees paid per day.
However, heightened activity and fees on Base (mainly stemming from the popular socialFi application friend.tech) have more than covered these data costs so far. Base is still very much in its infancy, and its role in Coinbase’s business merits close observation moving forward. How Coinbase plans to maximize decentralization on Base also remains an open question.
Despite a lingering high-profile regulatory battle with the SEC, the data above shows that Coinbase has continued to maintain its strong position in the digital assets industry. The adoption of cbETH and Base are evidence of a commitment to an on-chain future beyond the exchange, and other developments like an agreement with DeFi protocol Maker to custody USDC on behalf of the DAO, and push into derivatives also demand attention. But things haven’t been flawless along the way, as seen by the modest launch of Coinbase’s NFT platform. Yet, one of the most exciting aspects of these new business lines is the new ways in which we can use real-time data to examine a publicly-traded company. This report only touches on a few of the analyses which are made possible through the power of on-chain data.
Source: Coin Metrics Network Data Pro
We saw an increase in active addresses for Bitcoin and Ethereum even as the price stayed mostly flat, with a 6% and 24% increase, respectively. On-chain activity remains constrained across the board after a week with little price change.
This week’s updates from the Coin Metrics team:
-
Check out the latest issue of Coin Metrics’ State of the Market for more market data on Coinbase and other exchanges.
-
Last week marked the one year anniversary of Ethereum’s Merge. Check out our research report Mapping out The Merge to understand the significance of this event.
-
Explore the digital assets ecosystem through our entire catalog of original data-driven research.
As always, if you have any feedback or requests please let us know here.
Coin Metrics’ State of the Network, is an unbiased, weekly view of the crypto market informed by our own network (on-chain) and market data.
If you’d like to get State of the Network in your inbox, please subscribe here. You can see previous issues of State of the Network here.
© 2023 Coin Metrics Inc. All rights reserved. Redistribution is not permitted without consent. This newsletter does not constitute investment advice and is for informational purposes only and you should not make an investment decision on the basis of this information. The newsletter is provided “as is” and Coin Metrics will not be liable for any loss or damage resulting from information obtained from the newsletter.
Read More: coinmetrics.substack.com


 Bitcoin
  Ethereum
  Tether
  XRP
XRP  Solana
  USDC
USDC  Dogecoin
  Cardano
  TRON
TRON  Lido Staked Ether
  Wrapped Bitcoin
  Sui
Sui  Chainlink
  Wrapped stETH
  Avalanche
  Stellar
  Shiba Inu
  Hyperliquid
  Hedera
  LEO Token
  Bitcoin Cash
  Toncoin
  Litecoin
  Polkadot
  USDS
USDS  WETH
WETH  Pi Network
  Monero
  Wrapped eETH
  Bitget Token
  Pepe
Pepe  Binance Bridged USDT (BNB Smart Chain)
  Ethena USDe
  Coinbase Wrapped BTC
  WhiteBIT Coin
  Bittensor
  Uniswap
  Dai
Dai  NEAR Protocol
  Aptos
Aptos  Aave
Aave  OKB
OKB  Ondo
Ondo  Jito Staked SOL
  Cronos
  BlackRock USD Institutional Digital Liquidity Fund
  Internet Computer
  Ethereum Classic