Get the best data-driven crypto insights and analysis every week:
By: Kyle Waters and Tanay Ved
One of the most interesting aspects of the $100B+ stablecoin segment is the novelty public blockchains offer us in conducting economic data analysis on stablecoin adoption and use. On-chain data is an undisputed source of common truth that confirms the relentless rise of stablecoins. Apart from the macro-level stats like total addresses, supply, and transfer volume, we are also given an opportunity to scrutinize holder behavior with unprecedented granularity, something traditional financial data sets seldom provide.
It is increasingly evident that different stablecoins serve different purposes and are popular for certain use cases. Further, despite their nascent status, some stablecoins carry their own singular risk profile. With this in mind, an interesting question emerges: how often do we see an overlap in the user base of one stablecoin versus another? The account structure of Ethereum provides a perfect testing ground for this type of analysis. Unlike Bitcoin addresses where users are discouraged from address re-use, Ethereum accounts are more akin to bank or brokerage accounts—reused over and over again and often hold various assets.
In this issue of State of the Network, we dive into the topic of stablecoin co-ownership using data sourced from Coin Metrics’ ATLAS blockchain explorer. We also showcase an early use case of Coin Metrics’ recent address tagging endeavors.
We begin by collecting every account that held some amount of Tether (USDT), USDC, Pax Dollar, Dai, and Binance USD (BUSD) on Ethereum as of August 23rd, 2023. This proves to be exceedingly easy with the following query to the “List of accounts” CM API endpoint and CM Python API Client (for USDC for example):
from coinmetrics.api_client import CoinMetricsClient client = CoinMetricsClient(<CM_API_KEY>) client.get_list_of_accounts_v2(asset=“usdc”, page_size=10000 ).to_dataframe()We collected ~7M accounts that currently hold a non-zero balance. The split amongst them is 4.5M USDT accounts, 1.7M USDC accounts, 500K Dai accounts, 170K BUSD accounts, and finally 100K Pax accounts. This aggregate view can be confirmed with CM Network Data, here.
Subsequently, we merge all of the accounts together using their Ethereum address as the common key. This technique provides us a dataset that records the balance of each stablecoin for every account, summing up to 6.7M distinctive accounts.
In order to illustrate the intersection in ownership, we use a data visualization method called an UpSet plot. An UpSet plot is designed to clearly showcase how different groups, or sets, overlap with each other—especially when there are many groups involved. Most people are familiar with Venn Diagrams, which are great for visualizing the intersection of two groups. But Venn Diagrams get very messy with multiple combinations and subsets. This is where an UpSet plot proves most advantageous.
UpSet plots present this information in a grid, where connected dots in a row reveal which groups share members. Vertical bars indicate the number of members in these overlaps. By observing where dots line up and the height of the bars, you can understand how and by how much groups intersect.
In the following sections, we create UpSet plots to understand stablecoin ownership trends. In each step, we further refine the analysis by removing certain account types, helping us to better examine different user behaviors and preferences.
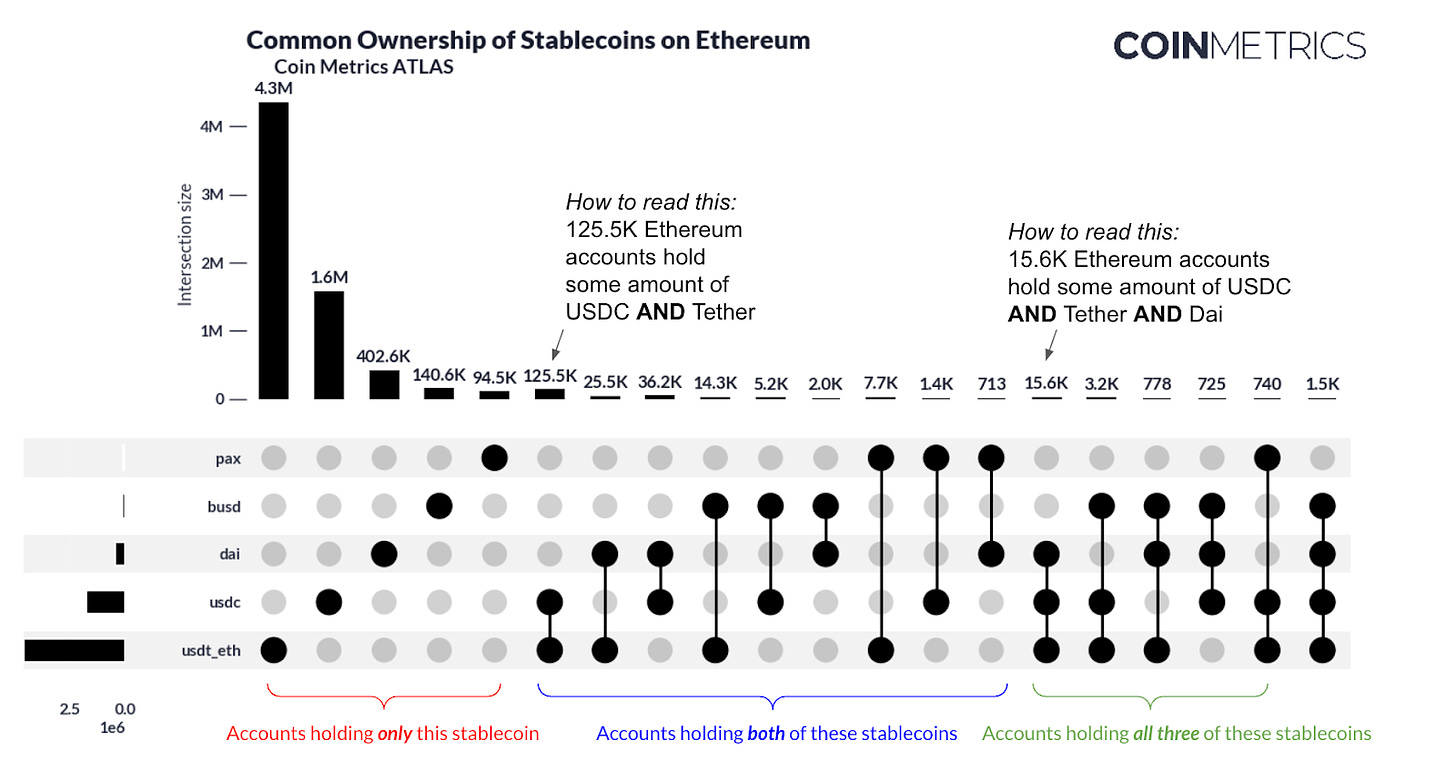
As a first pass, we start with all accounts that hold a non-zero balance. As mentioned earlier, there are just around 6.7M unique accounts that hold some amount of the 5 stablecoins we’ve included.
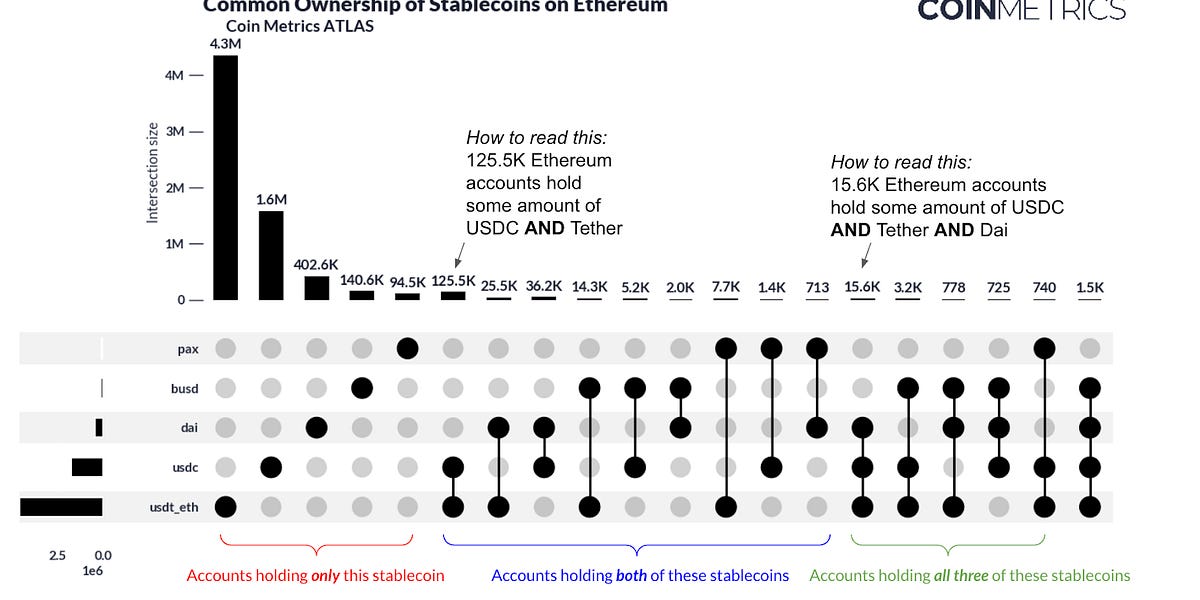
The chart above shows that overlap is actually fairly uncommon (note we’ve only included the top 20 subsets, combinatorially there are 31 total
). For example, out of the 6.1M unique accounts holding some amount of USDC or Tether, there are only about 150K that hold some of both (~2%). This is perhaps not too surprising given past research: we’ve shown that USDC and Tether tend to be used at different times of the day with USDC being used during North American business hours, and Tether being used primarily during European and Asian market hours. It might equally be a matter of convenience whereby a user would opt for a single stablecoin over many. A remarkably small number of addresses (348) hold some of all 5 stablecoins (not shown in the graph).
But this is just a first look—for a more accurate view we should hone in on account types that best reflect human users.
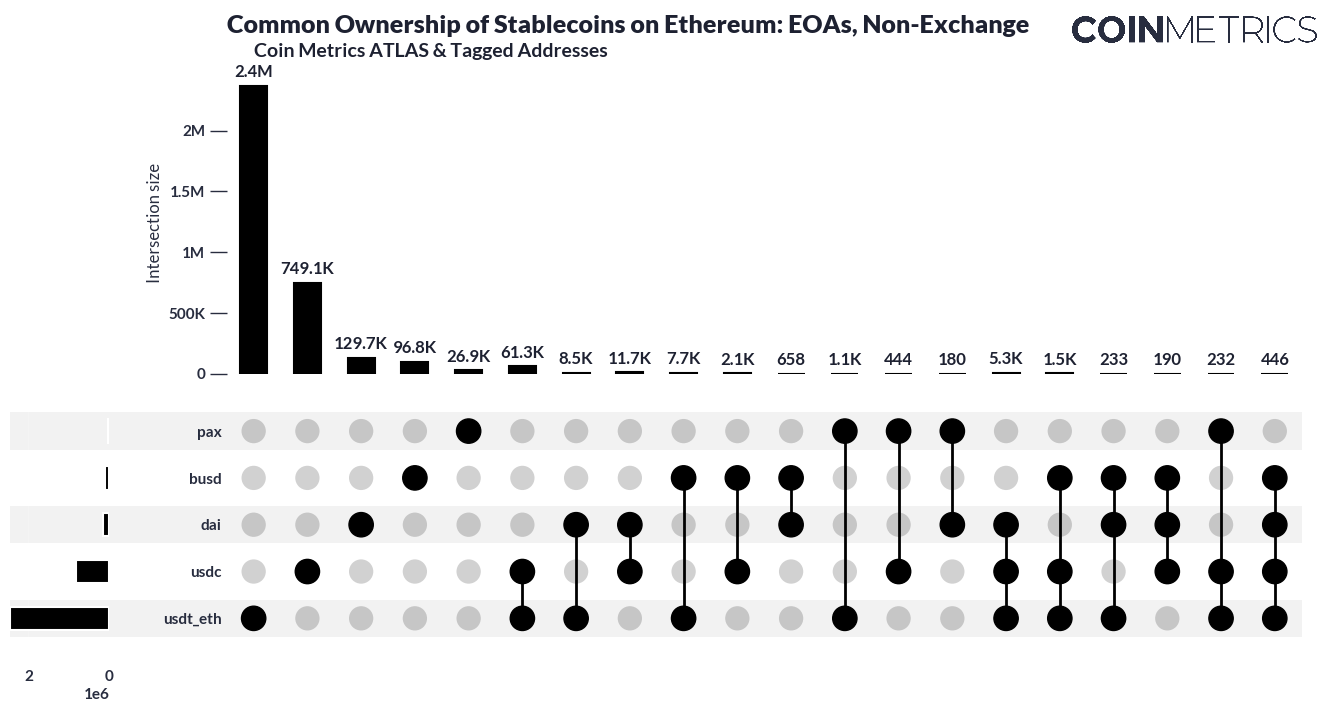
A common problem faced in on-chain analysis is dealing with dust addresses. Dust addresses hold very small amounts of a token (less than or equal to $10) such that after transaction fees, it is usually not even worth moving. There are many such small stablecoin addresses on Ethereum. A total of 45% of addresses (~2M addresses) holding some amount of Tether on Ethereum hold less than $10. Similarly, this figure is about 50% for USDC. The chart above corrects for this by excluding all accounts holding less than $10 in value (e.g. if an account holds $1,000 of Tether and $2 of USDC, it is counted as holding just Tether).
Then, we use an early version of Coin Metrics’ address tagging data to exclude smart contracts (to exclude things like DeFi protocols) and exchange addresses, to focus on just singular users. Of course, it is important to note that one address still may not necessarily represent one human being (and often users have multiple addresses), but these adjustments get us closer.
Here, we see that holding multiple stablecoins is still fairly uncommon. Only 69K addresses hold both USDC and Tether, out of the adjusted 3.2M unique externally-owned, non-exchange accounts holding greater than 10 dollars of either USDC or Tether (about 2% still).
Another way we can slice the data is by making further adjustments on an account’s total balance. Here, we restrict accounts to have a total balance (summing across all holdings) between $100 and $10,000 (still removing smart contracts and exchanges). There are a total of 1.2M such addresses. Many of the same trends as above hold, especially for Tether and USDC.
One interesting note is that Dai holders are much more likely to diversify their holdings. Of the ~50K accounts holding Dai, about 15K or 30% of them held one of the other 4 stablecoins. This could be due to the nature of Dai as a (mostly) crypto-overcollateralized stablecoin.
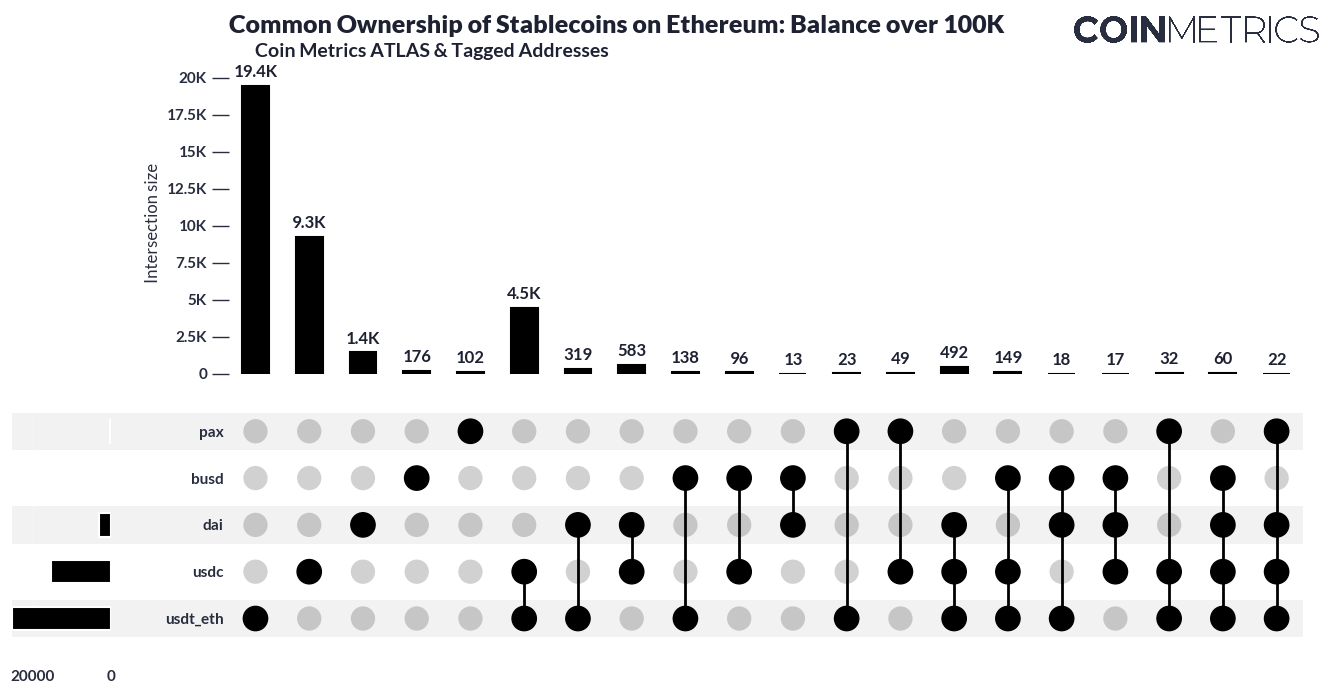
Next, we can drill down to just those accounts with total holdings of stablecoins over $100,000, and at least a balance of $10K in any stablecoin to get a better sense of any propensity to diversify (to avoid counting intersections where, say, an account holds $1M USDC but only $200 of Tether). Across these 5 stablecoins, there are 37K such accounts.
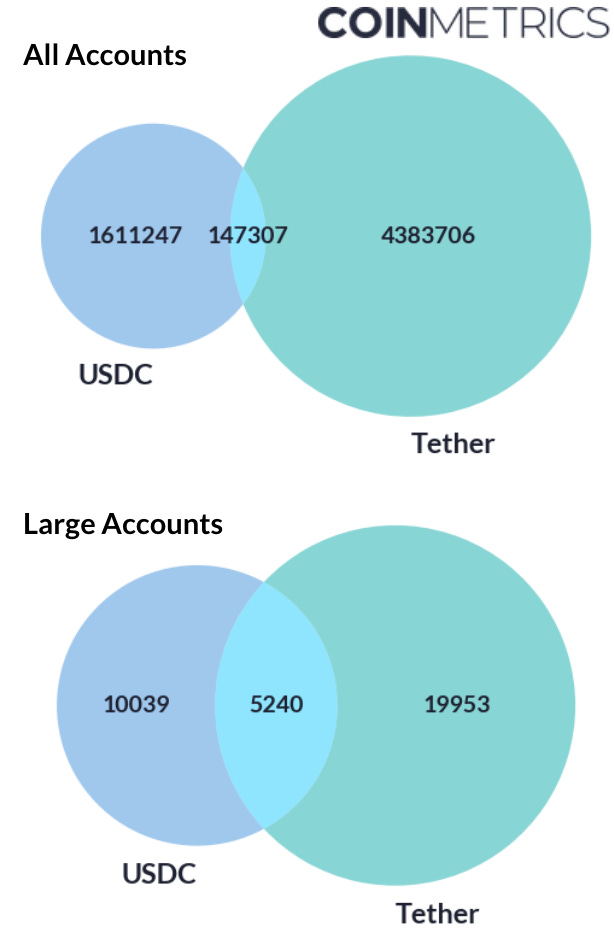
A very interesting trend emerges when looking at large accounts, where the stakes are ostensibly higher. Now, we see that intersections are much more pronounced. First, we see that a total of about 5.2K (4.5K+492+149+32+60+22) large addresses hold Tether and USDC. This is a much higher proportion than what we observed with all addresses. This becomes even more clear looking at a Venn Diagram:
While only 10% of all USDC addresses hold some amount of another stablecoin, 40% of all large USDC-owning accounts carry at least $10K of another stablecoin. This is also true to a lesser extent for Tether holders. Only 4% of all Tether holders own another stablecoin, but 23% of large holders own another stablecoin.
This makes sense from a diversification perspective. Large holders, having more at stake, should be incentivized to spread their funds around if possible. This last point is important. If a holder is unable to access the financial rails to offramp from that stablecoin to fiat, it might not be of much value to hold that stablecoin. This might explain why some holders of Tether (an offshore stablecoin) are less likely to diversify their holdings to an onshore stablecoin like USDC.
Finally, recent market events may have played a key role in catalyzing holder diversification. The collapse of Silicon Valley Bank in March of this year introduced a brief but volatile shock to holders of USDC.
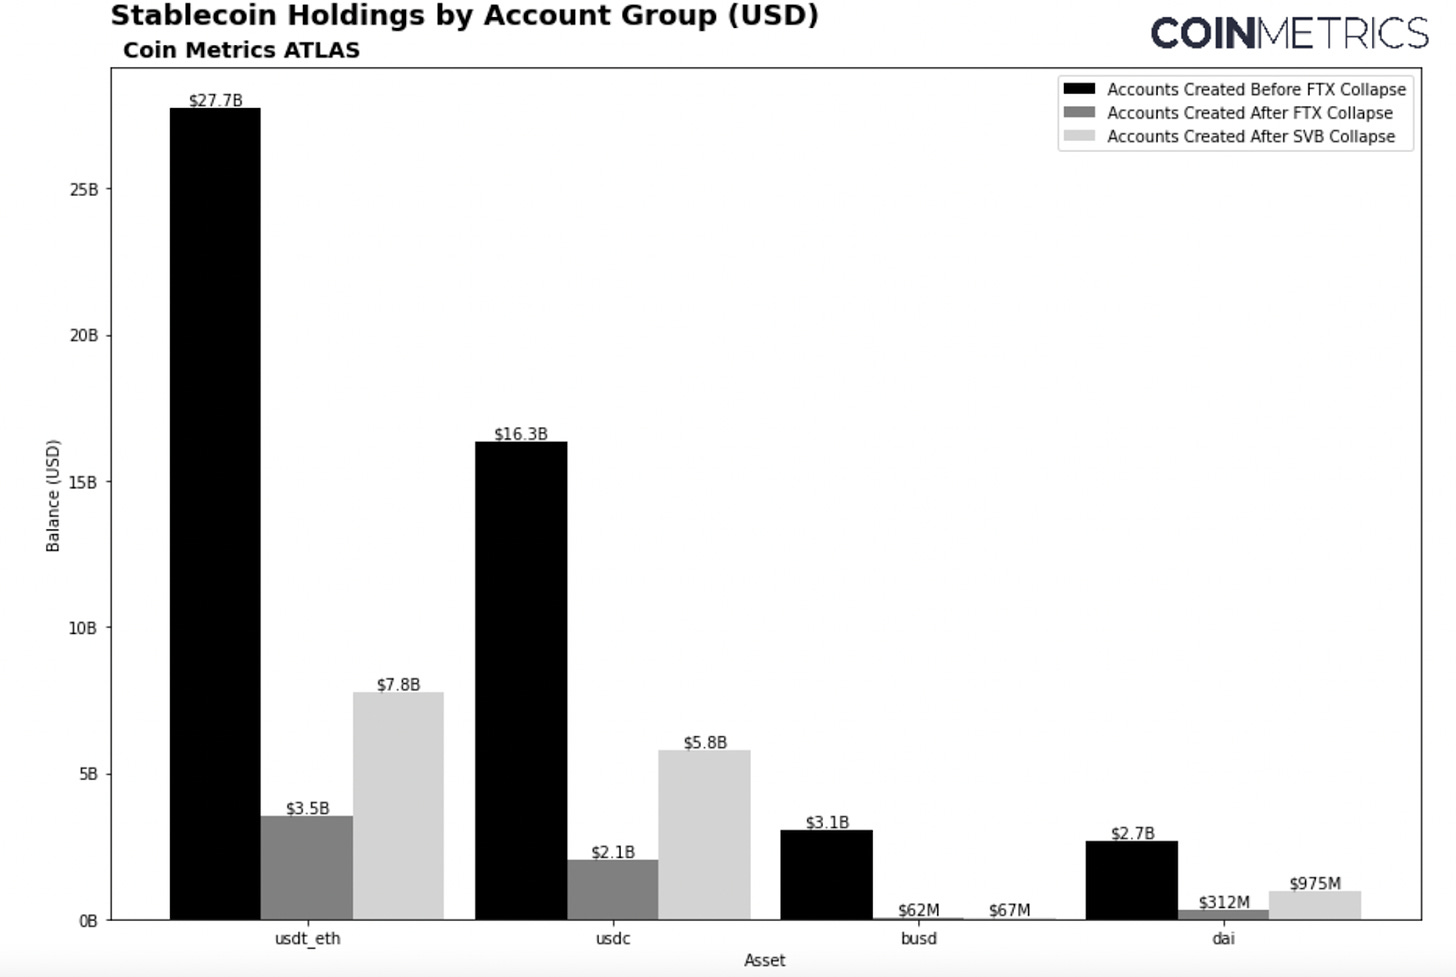
To assess how significant market events have influenced user preferences around stablecoins, we can divide all accounts into three distinct cohorts based on their date of creation. This allows us to probe into the repercussions of major events like FTX’s collapse and the fallout of the Silicon Valley Bank (SVB) crisis. Accounts are grouped into those created before November 11th, 2022, between November 11th, 2022 and March 10th, 2023, and accounts created after March 10th 2023—resulting in a set of non-overlapping accounts.
The analysis of relative changes in balances between these accounts gives valuable insight into evolving user preferences. It becomes evident that accounts created before FTX’s collapse had a stronger preference for holding USDT over USDC, with a ratio of 1.69. This preference appears to strengthen after FTX’s collapse, rising to 1.72, followed by a decline to 1.34—suggesting that there is a trend towards USDC for newer accounts created after March. Similarly, the ratio of USDT to BUSD experienced a drastic jump, going from 9.04 before the FTX collapse to 115.4 following the SVB collapse. This signifies a relative decline in the adoption of BUSD compared to USDT. Interestingly, in comparison to BUSD, DAI also appears to be greatly favored amongst newer users. Even though this approach has some limitation—including neglecting dynamic shifts in older accounts and variations in initial capital—it nonetheless offers crucial insights into the shifts in relative adoption, which are influenced by major market events that can tip users’ perception of risk.
This report merely provides a brief overview of stablecoin user analysis possibilities. We could refine our user segmentation further by considering additional behavioral characteristics. This could include the frequency that the user transacts, whether they are DeFi protocol users, NFT holders, or own other types of ERC-20s, along with their choice of exchange, among other factors. As the stablecoin market grows and more options become available, we also gain the ability to examine more specific subsets of co-ownership. All of this rich and detailed analysis is made possible in real-time by harnessing the power of on-chain data.
Source: Coin Metrics Network Data Pro
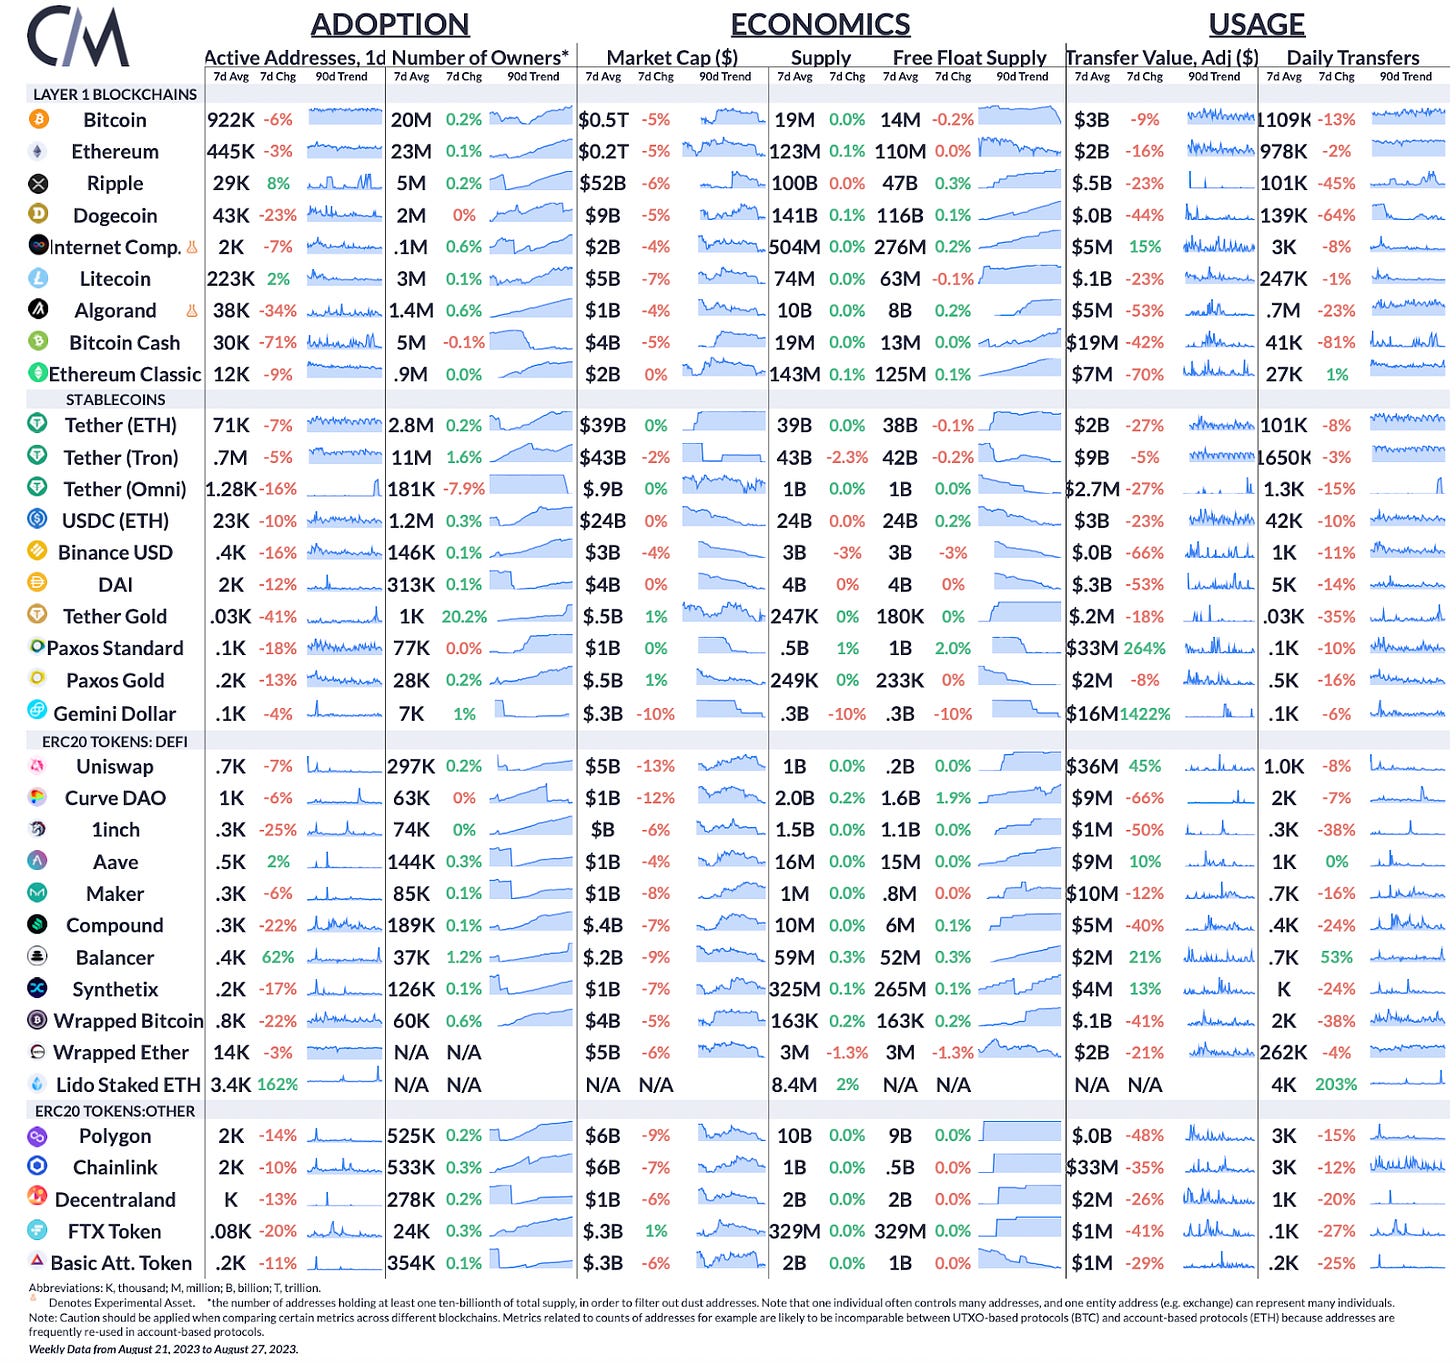
Daily active addresses on Ripple rose by 8%, while activity on Bitcoin and Ethereum slipped by 6% and 3% respectively. Meanwhile, Balancer experienced a 62% surge in activity as the DeFi protocol was exploited for 900k, while active addresses of Lido Staked ETH gained 162% as Mantle, a Layer-2 network struck a strategic deal with Lido.
This week’s updates from the Coin Metrics team:
-
Check out the latest issue of Coin Metrics’ State of the Market for notable events from the past week in addition to a new page dedicated to aggregate BTC and ETH spot volume
-
Explore the digital assets ecosystem through our entire catalog of original data-driven research.
As always, if you have any feedback or requests please let us know here.
Coin Metrics’ State of the Network, is an unbiased, weekly view of the crypto market informed by our own network (on-chain) and market data.
If you’d like to get State of the Network in your inbox, please subscribe here. You can see previous issues of State of the Network here.
© 2023 Coin Metrics Inc. All rights reserved. Redistribution is not permitted without consent. This newsletter does not constitute investment advice and is for informational purposes only and you should not make an investment decision on the basis of this information. The newsletter is provided “as is” and Coin Metrics will not be liable for any loss or damage resulting from information obtained from the newsletter.
Read More: coinmetrics.substack.com






 Bitcoin
  Ethereum
  Tether
  XRP
XRP  Solana
  USDC
USDC  Dogecoin
  TRON
TRON  Cardano
  Lido Staked Ether
  Wrapped Bitcoin
  Hyperliquid
  Sui
Sui  Wrapped stETH
  Chainlink
  Avalanche
  Stellar
  Bitcoin Cash
  Toncoin
  LEO Token
  Shiba Inu
  Hedera
  WETH
WETH  Litecoin
  USDS
USDS  Wrapped eETH
  Monero
  Polkadot
  Binance Bridged USDT (BNB Smart Chain)
  Ethena USDe
  Bitget Token
  Pepe
Pepe  Pi Network
  Coinbase Wrapped BTC
  WhiteBIT Coin
  Aave
Aave  Uniswap
  Bittensor
  Dai
Dai  Ethena Staked USDe
  Aptos
Aptos  NEAR Protocol
  Cronos
  Jito Staked SOL
  OKB
OKB  BlackRock USD Institutional Digital Liquidity Fund
  Internet Computer
  Ondo
Ondo  Ethereum Classic