Bitcoin Analysis
Bitcoin’s price struggled on Tuesday after two consecutive days that were led by bullish market participants and BTC closed its daily session -$220.
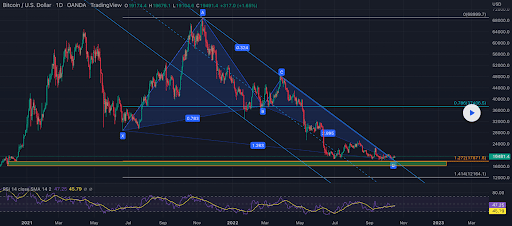
The first Bitcoin chart we’re looking at for Wednesday is the BTC/USD 1D chart from PetrBorosh. BTC’s price is trading between the 1.272 fibonacci level [$17,871.8] and 0.786 [$37,406.5], at the time of writing.
The targets to the upside for bullish traders that believe a break out on the 1D time frame is forthcoming are 0.786 and a full retracement at the 0 fib level [$68,999.7] on the OANDA chart.
Bearish traders have their sights set on pushing BTC’s price below the 1.272 and making a new 12-month low on the world’s premiere digital asset by market capitalization.
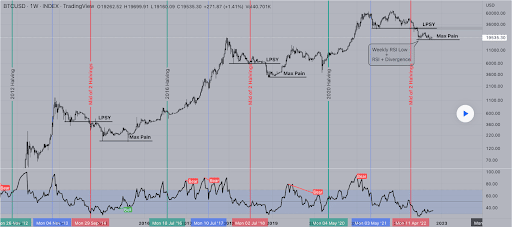
The second Bitcoin chart we’re looking at today is the BTC/USD 1W chart below from jasperfreeman. The chartist posits that BTC’s price has reached its max pain threshold and if they’re correct, from here the asset could follow prior bear markets and selling pressure from bears may begin to wane.
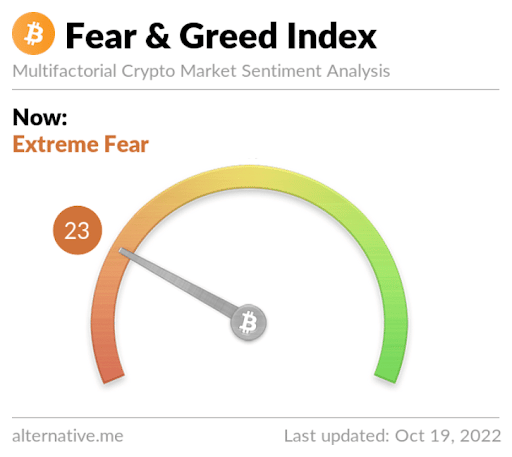
The Fear and Greed Index is 23 Extreme Fear and is +1 from Tuesday’s reading of 22 Extreme Fear.
Bitcoin’s Moving Averages: 5-Day [$19,363.24], 20-Day [$19,416.23], 50-Day [$20,465.8], 100-Day [$21,711.01], 200-Day [$30,386.46], Year to Date [$30,833.87].
BTC’s 24 hour price range is $19,091-$19,706.7 and its 7 day price range is $18,372.47-$19,872.75. Bitcoin’s 52 week price range is $17,611-$69,044.
The price of Bitcoin on this date last year was $64,275.5.
The average price of BTC for the last 30 days is $19,362.5 and its -2.1% over the same stretch.
Bitcoin’s price [-1.13%] closed its daily candle worth $19,328.1 on Tuesday and in red digits for the first time in three days.
Ethereum Analysis
Ether’s price also marked-down on Tuesday and closed its daily session -$20.59.
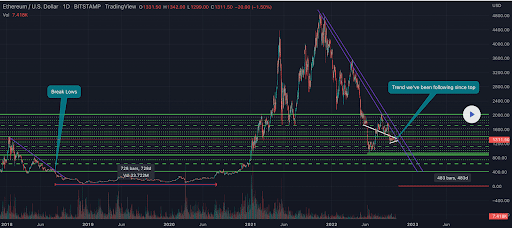
The second chart for analysis today is the ETH/USD 1D chart below from degenciaga.
We can see ETH’s price is testing a trendline that it’s been following since its all-time high of $4,878 was put in.
Bullish traders want to break this level soon or bearish traders again could signal to market participants that they’re still in possession of the momentum of Ether’s market.
Ether’s Moving Averages: 5-Day [$1,309.28], 20-Day [$1,323.56], 50-Day [$1,522.42], 100-Day [$1,464.47], 200-Day [$2,116.70], Year to Date [$2,161.37].
ETH’s 24 hour price range is $1,286.72-$1,340.87 and its 7 day price range is $1,216.50-$1,340.87. Ether’s 52 week price range is $883.62-$4,878.
The price of ETH on this date in 2021 was $3,876.71.
The average price of ETH for the last 30 days is $1,321.83 and its -8.77% over the same span.
Ether’s price [-1.55%] closed its daily session on Tuesday worth $1,310.81 and also in negative figures for the first time in three daily candle closes.
Fantom Analysis
Fantom’s price also dropped on Tuesday and when traders settled-up to close the day, FTM’s price was -$0.0037.
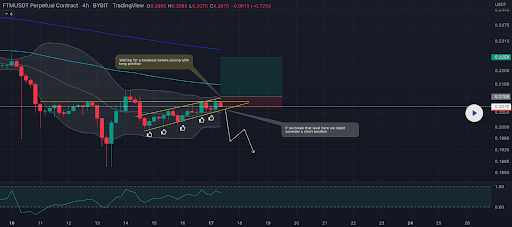
The FTM/USD 4HR chart below from SwallowPremium is the third chart we’re looking at for Tuesday.
Traders can see that FTM’s price is tucked in neatly within a triangle pattern with bullish and bearish traders hoping to get their favorable result.
Bullish FTM market participants want to break out with candle close confirmation on the 4HR and then the daily time frame above the $0.209 level.
Those shorting FTM however want to continue the asset’s descent and mark a fresh 2022 low thereafter. A breakout to the downside for bearish traders of this market occurs below $0.206.
Fantom’s Moving Averages: 5-Day [$0.2066], 20-Day [$0.22], 50-Day [$0.2647], 100-Day [$0.2811], Year to Date [$0.4827].
Fantom’s 24 hour price range is $0.2042-$0.2163 and its 7 day price range is $0.1929-$0.2163. FTM’s 52 week price range is $0.1883-$3.47.
Fantom’s price on this date last year was $2.35.
The average price of FTM over the last 30 days is $0.2211 and its -15.55% for the same period.
Fantom’s price [-1.74%] closed its daily candle on Tuesday worth $0.2087 and in red figures, like BTC and ETH, for the first time in three days.
Read More: en.cryptonomist.ch


 Bitcoin
  Ethereum
  XRP
XRP  Tether
  Solana
  Dogecoin
  USDC
USDC  Cardano
  Lido Staked Ether
  TRON
TRON  Avalanche
  Sui
Sui  Wrapped stETH
  Toncoin
  Stellar
  Shiba Inu
  Chainlink
  Wrapped Bitcoin
  Hedera
  WETH
WETH  Polkadot
  Bitcoin Cash
  LEO Token
  Uniswap
  Litecoin
  Pepe
Pepe  Hyperliquid
  Wrapped eETH
  USDS
USDS  NEAR Protocol
  Ethena USDe
  Aptos
Aptos  Internet Computer
  Aave
Aave  Mantle
  Ethereum Classic
  POL (ex-MATIC)
  Monero
  Cronos
  Render
  Bittensor
  MANTRA
  Dai
Dai  Artificial Superintelligence Alliance
  Filecoin
  Arbitrum
  Tokenize Xchange