- Bitcoin price falls into a key Fibonacci level.
- Ethereum price shows the possibility of a recovery rally.
- Ripple price could be setting up for one more low within the coiling range.
The crypto market is at a crossroads. The next move will likely determine the trend for weeks to come. Key levels have been defined.
Bitcoin price at a fork in the road
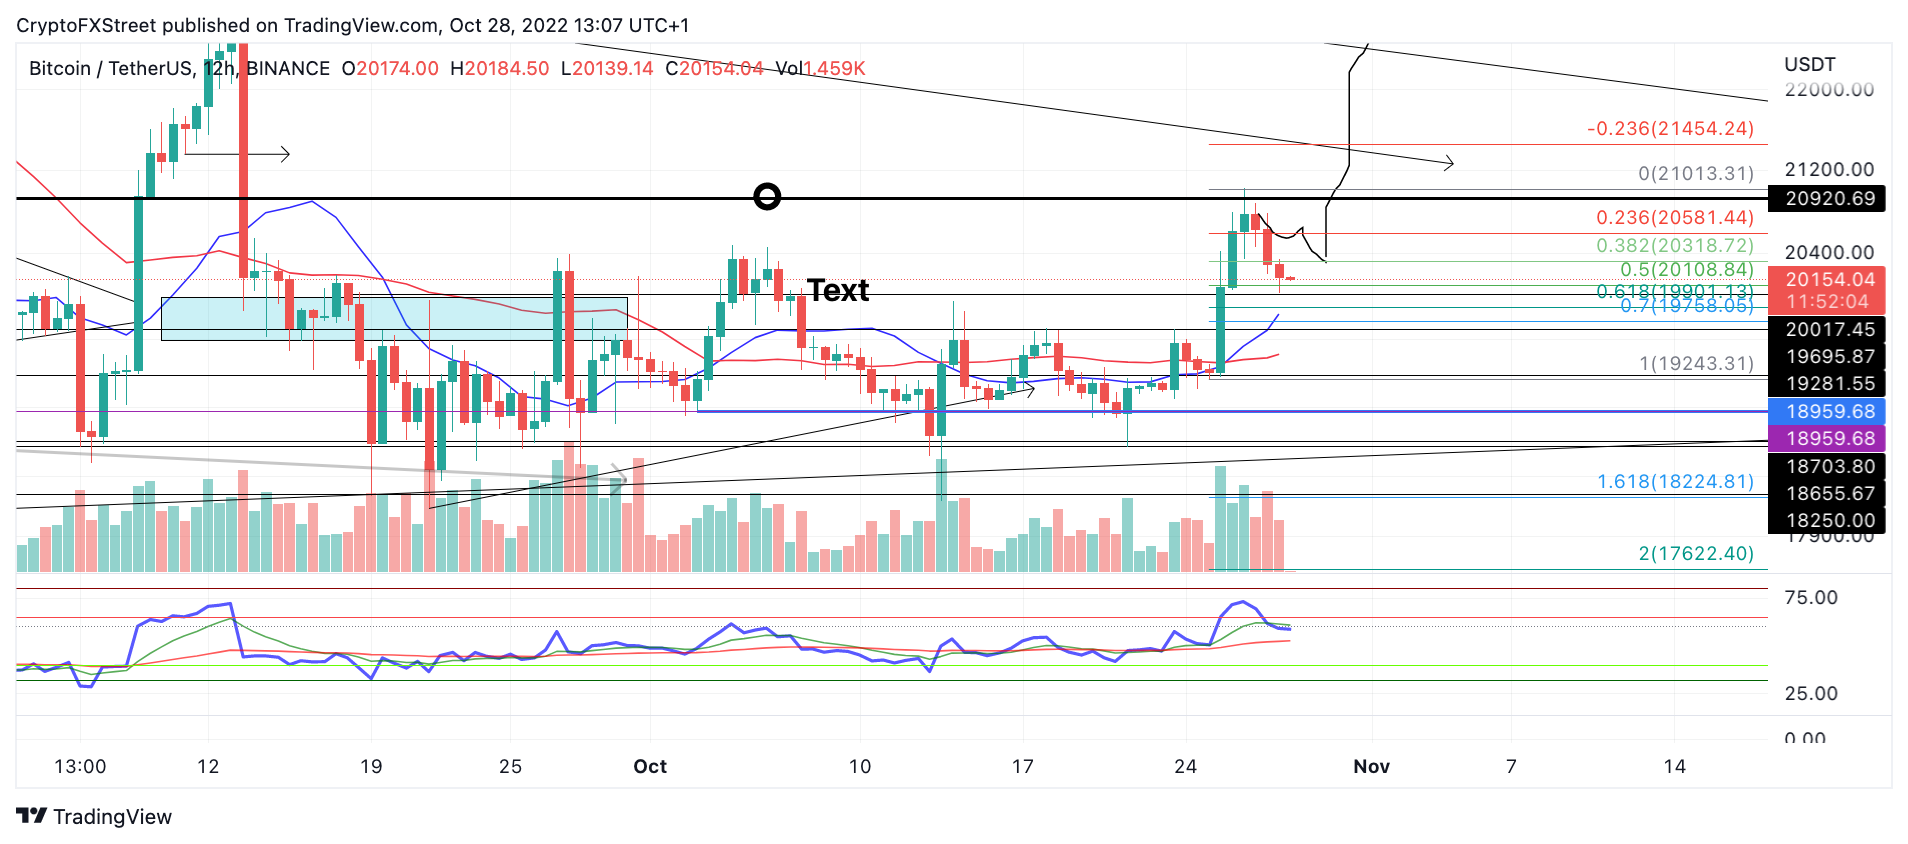
Bitcoin price currently trades at $20,503. After being rejected from the $21,000 level on Wednesday, October 26, the peer-to-peer digital currency fell 4%. As it hovers a few hundred dollars above the 2017 all-time highs at $19,600, leaving investors to wonder, what will happen next?
Bitcoin price breached overbought conditions upon the previous rally. If a bounce is to occur, a divergence between swing lows on the Relative Strength Indicator would be ideal for sidelined bulls to enter the market. Currently, the RSI does not show a divergence but is coming down to test previous resistance zones as support. If the market is genuinely bullish, $22,000 could be the next target, provided that support is established soon.
The bulls have yet to retest the 8-day exponential moving average (EMA) at $19,700 after piercing through it earlier in the week. A Fibonacci retracement tool surrounding the strongest part of this week’s rally shows the current low within the sell-off as a 61.8% retracement. The bears’ ability to head any lower would be concerning for the health of the uptrend.
The bullish thesis would be void if the swing low at $18,650 were tagged. If the bears happen to re-tag that level, a further decline toward the October 13 lows at $18,300 would likely commence. Such a move would result in an 8% dip from Bitcoin’s current market value.
BTC/USDT 4-Hour Chart
In the following video, our analysts deep dive into the price action of Bitcoin, analyzing key levels of interest in the market. -FXStreet Team
Ethereum shows strength
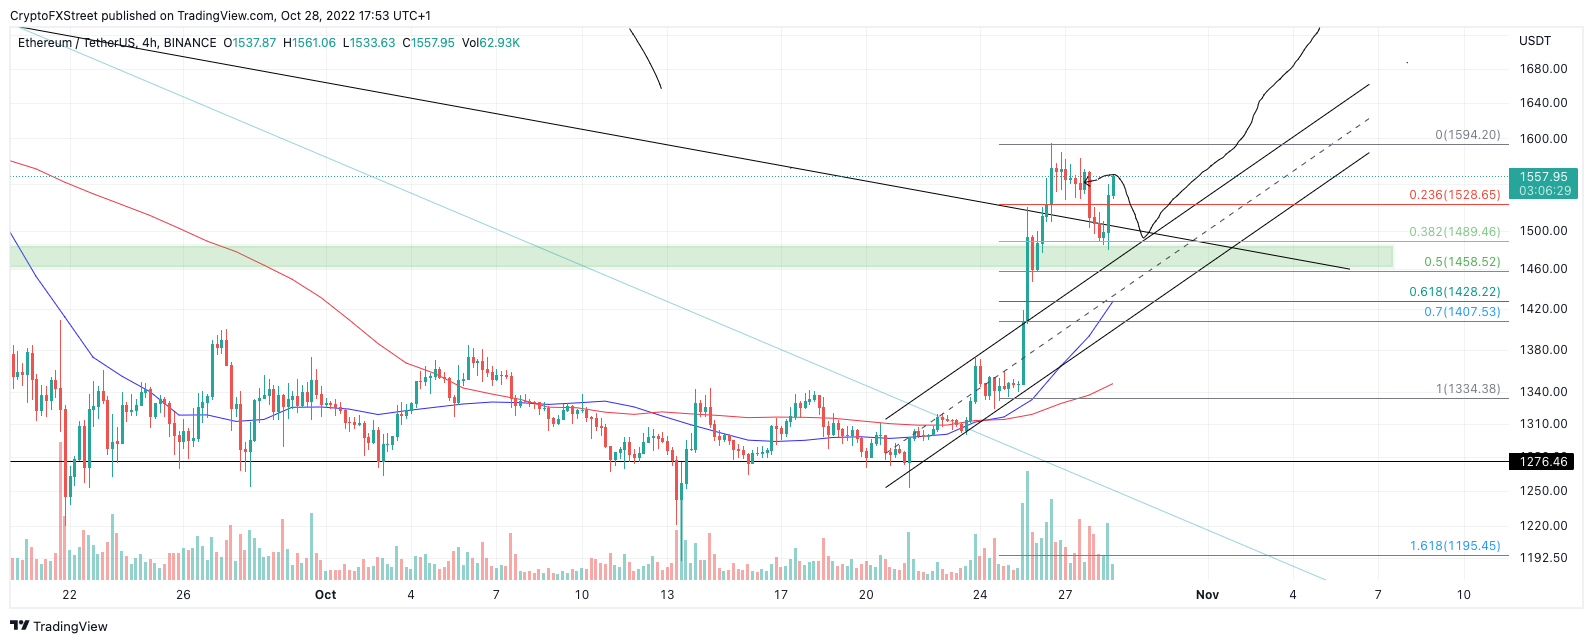
Ethereum price witnessed a 5% bounce during the final Friday of October. Ethereum, the decentralized smart contract token, fell into the mid $1,390 level during the overnight session and rebounded with an uptick in volume by New York’s opening bell.
Ethereum price auctions at $1,545. If the market is genuinely bullish. ETH’s price should propel toward the $1,600 level over the weekend. Traders should keep the decentralized smart-contract token that has yet to retest the ascending trend channel, which broke through earlier this week. A break below the swing low at $1,450 could trigger a sell-off into the lower half of the trend channel at $1,407.
ETH/USDT 4-Hour Chart
In the following video, our analysts deep dive into the price action of Ethereum, analyzing key levels of interest in the market. -FXStreet Team
XRP price could print a new low
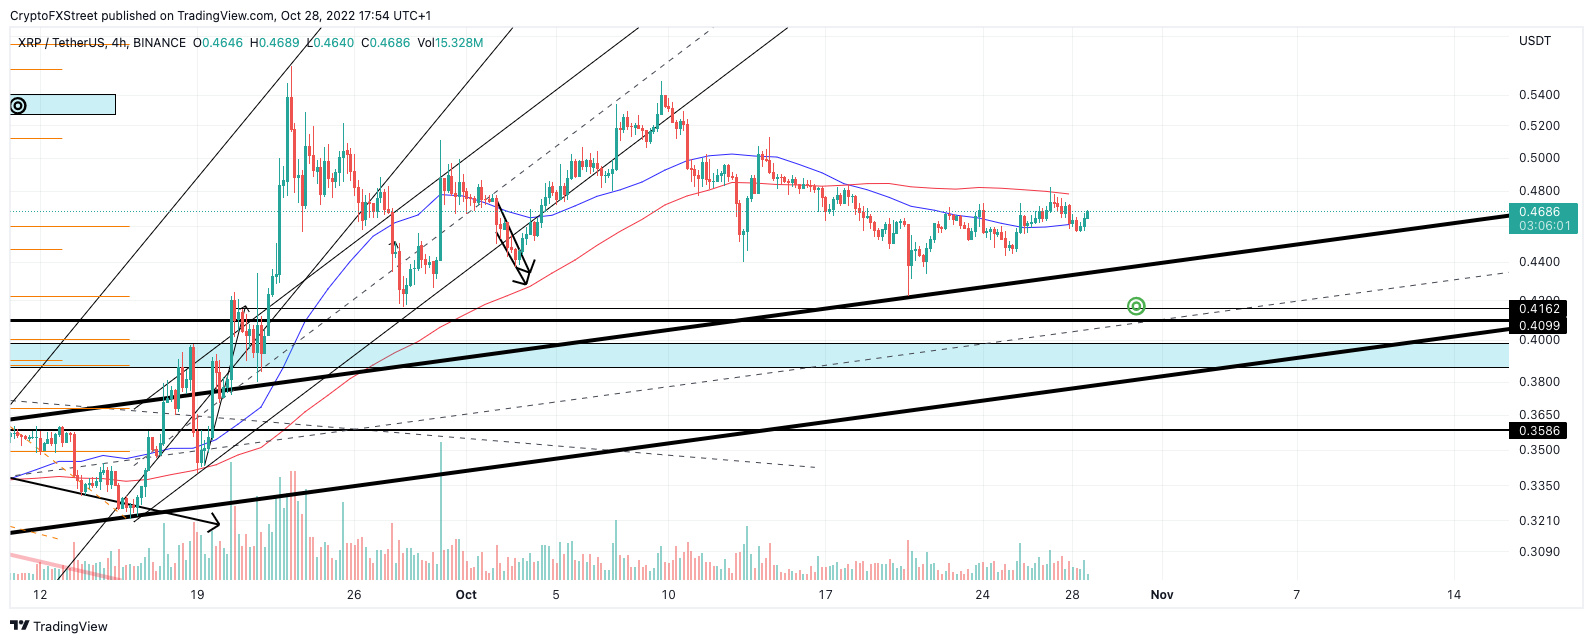
XRP price is in a challenging situation. As the trading range coils from October’s highs at $0.54 to the lows at $0.42, most of the trading has taken place near the lower half. The digital remittance token remains submerged as low volume continues to signal a bullish lack of interest.
XRP price auctions at $0.4676. An optimistic signal is that the 8-day exponential moving average has provided support, enabling Ripple’s ongoing 3% bounce. The bad news is that the 21-day simple moving average rejected the price prior, and the volume shown does not look substantially different from Ripple’s previous attempt.
A failure to hurdle the 21-day simple moving average at $0.48 could lead to a sweep-of-the-lows-event targeting $0.41. Such a move would result in an 11% decline from the current market value.
Invalidation of the bearish idea is a breach above the October 27 swing high at $0.48. If the bulls manage to reconquer the $0.48 barrier, an additional rally targeting September highs at $0.56 could occur. Such a move would result in an 18% increase from the current XRP price.
XRP/USD 4-Hour Chart
In the following video, our analysts deep dive into the price action of Ripple, analyzing key levels of interest in the market. -FXStreet Team
Read More: news.google.com







 Bitcoin
  Ethereum
  XRP
XRP  Tether
  Solana
  Dogecoin
  Cardano
  USDC
USDC  Lido Staked Ether
  Avalanche
  TRON
TRON  Shiba Inu
  Stellar
  Toncoin
  Wrapped stETH
  Polkadot
  Chainlink
  Wrapped Bitcoin
  Hedera
  Bitcoin Cash
  WETH
WETH  Sui
Sui  Litecoin
  Pepe
Pepe  Uniswap
  NEAR Protocol
  LEO Token
  Wrapped eETH
  Aptos
Aptos  Internet Computer
  USDS
USDS  POL (ex-MATIC)
  Cronos
  Ethereum Classic
  Artificial Superintelligence Alliance
  Ethena USDe
  Bittensor
  Render
  Filecoin
  Algorand
  Arbitrum
  Aave
Aave  Cosmos Hub
  Stacks
  Dai
Dai  WhiteBIT Coin
  Immutable