At 0xArc, we need to have every piece of data, on every chain, at every point in time (past, present and to-be-future). As a result, our data warehouses are hundreds of terabytes in size. To get this data we’ve made billions of RPC calls and continue to make hundreds of millions per month across many blockchain networks. Unfortunately, we found, on average, RPC calls to nodes work approximately ~80% of the time depending on conditions with 10x variances in pricing! This article shares some of our findings and will hopefully be useful to the rest of the community.
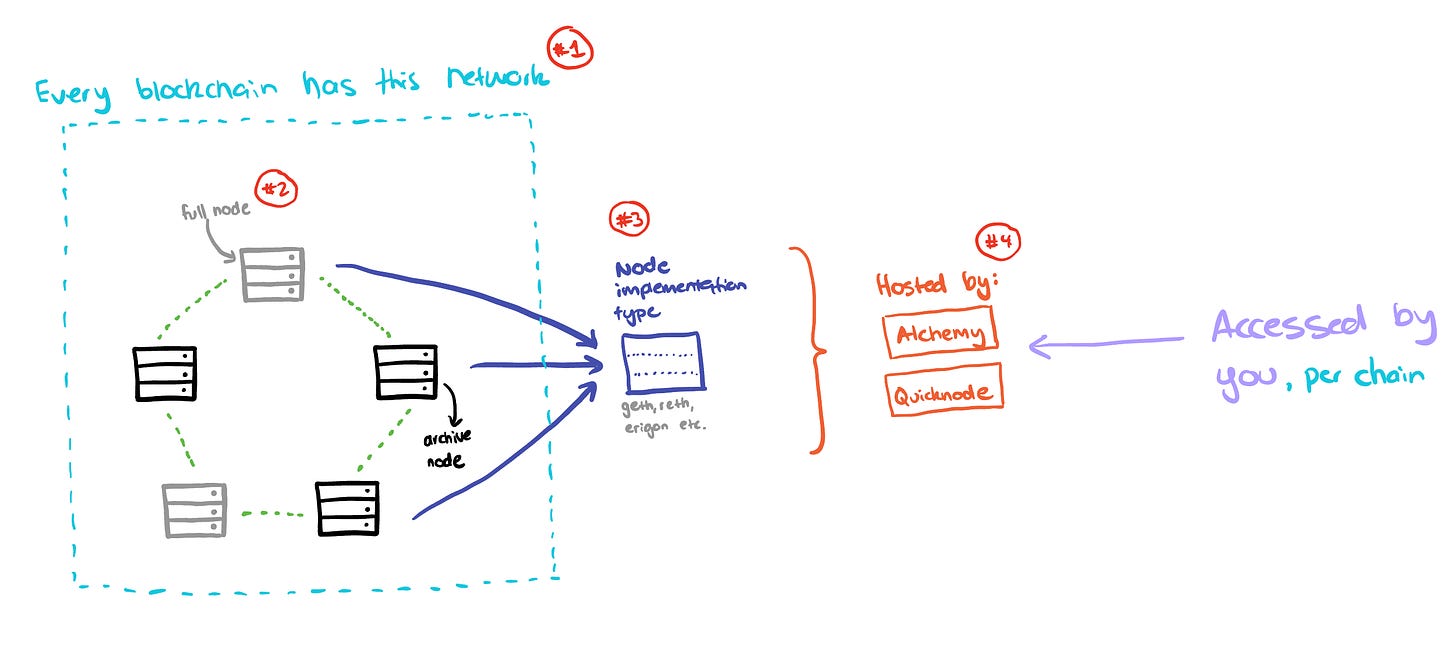
Before we talk about numbers it’s important to understand how the node industry works in crypto so we can properly understand what we’re discussing. While it’d be great if everyone ran their own nodes and we followed perfect principles of decentralisation, the reality is that running a node is complex and requires expertise. Therefore we delegate this responsibility to a node provider. This diagram is based on how the commercial node industry works in 2024 in crypto.
At a high level, you have full or archive nodes that are run on a specific type of node implementation (geth/reth/erigon). These nodes are hosted by a provider such as Alchemy or Quicknode for every blockchain network they support. You as the RPC consumer access all of this at the end of the line.
When you deconstruct this chain of logic, you have 4 primary dimensions that will greatly impact performance:
-
The chain you’re making RPC requests to: each chain’s network of nodes behave differently and have differing activity levels.
-
The method you’re calling: this will depend if you’re making full or archive node calls and the node client implementation.
-
The provider that you’re using: the entity that hosts the nodes for you to access.
-
When you call the node: node performance varies across all of the above dimensions over time, it is not constant.
Being able to instrument and understand this data can be very challenging. However, at 0xArc this is our job as we make billions of RPC calls and carefully monitor the performance of everything we touch. Performance, reliability and cost are paramount to us. We know when a chain is down or when a RPC provider is down before most market participants. Here is the context of the data we’ll looking at in this article:
In order to properly understand what’s happening with over 1b+ rows of data, we’re going to have to slice and dice it across many dimensions. Luckily, we know what those are through the points I made above.
The rest of the article will show unique instances of how performance can vary across each of these dimensions in an unpredictable way.
Suppose you’re building a cross-chain application that relies on interfacing with various networks. Your node’s performance will vary significantly based on the chain you’re calling and the time you’re calling it.
This first graph is showing what the average success rate for each chain per day was aggregated across all providers and methods. As you can see from the chart below, the average success rate you get from chains varies significantly almost every month. We’re not sure why this may be the case but we can see that Polygon calls were successful on average 60% of the time in August but then have spiked up to 80%+ in more recent weeks.
A key caveat of this data when evaluating it is not: “Polygon is a bad chain and RPC calls only succeed 70% of the time on average”. This is the blended average success rate across all chains, all providers, all methods over a ~2.5 month period. As we dig into any of these dimensions the data changes significantly.
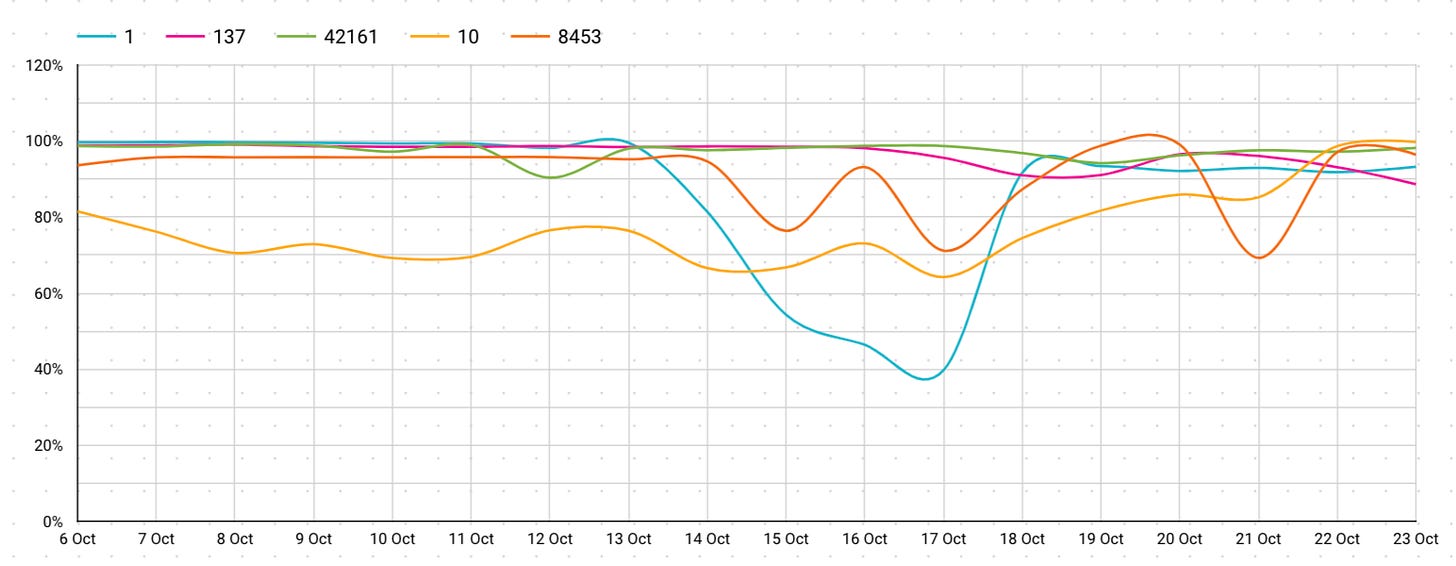
This is the same chart but for a 17 day period and filtered by a single provider. As you can see the graph is a lot smoother and varies from the overall aggregate.
If we see a single provider doing well, what stops us from doubling down on them all the time? The next section addresses that question with more nuance.
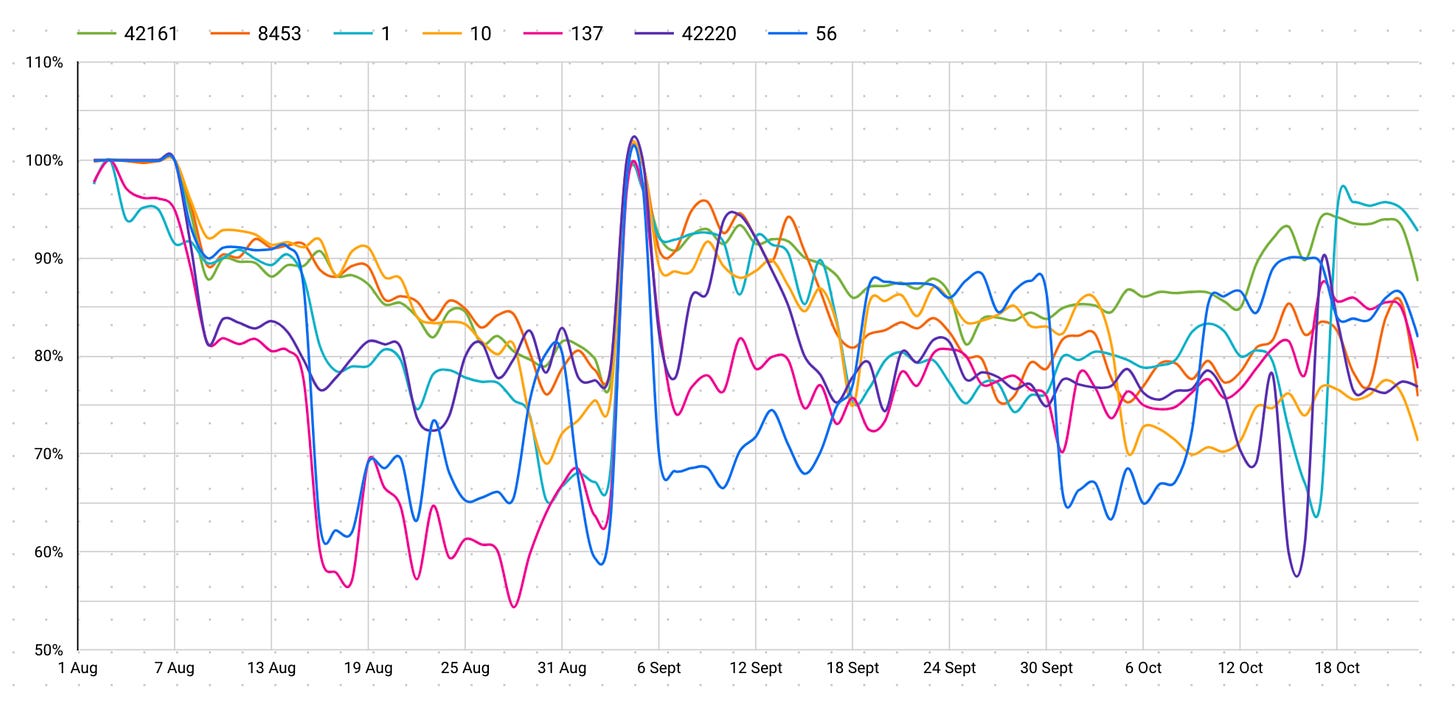
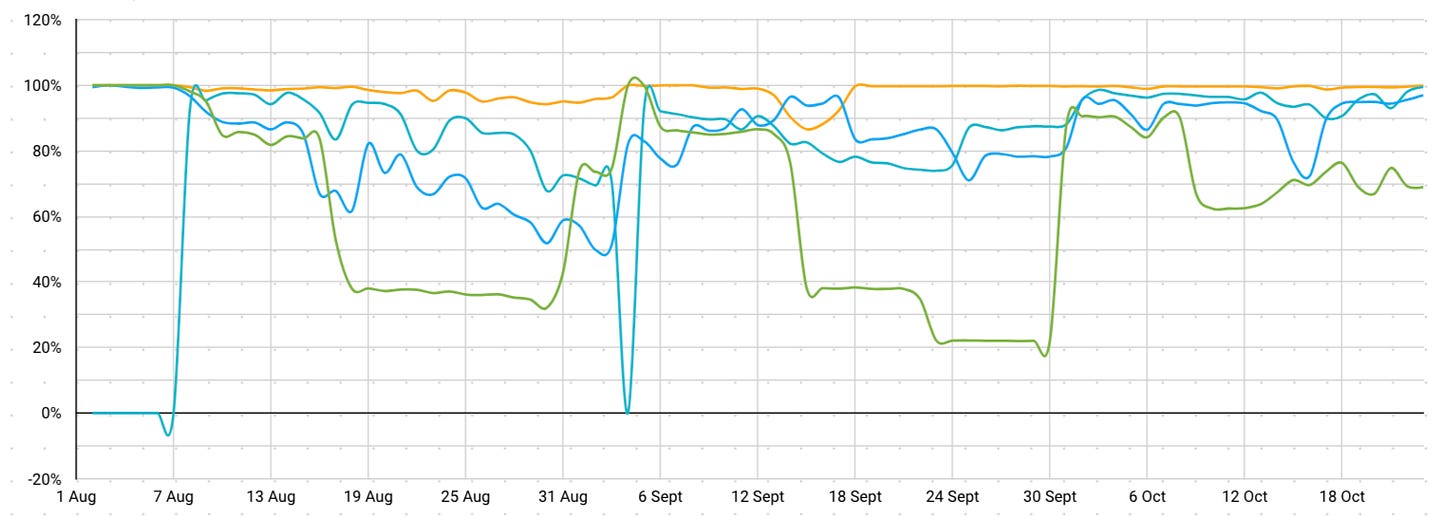
This next graph I simplified because I wanted to avoid having too many lines. Each of these represents a major RPC provider network and their success rate aggregated across all chains and methods. As you can see from the chart below, the orange provider is one of the most reliable relative to the others and the difference is quite staggering!
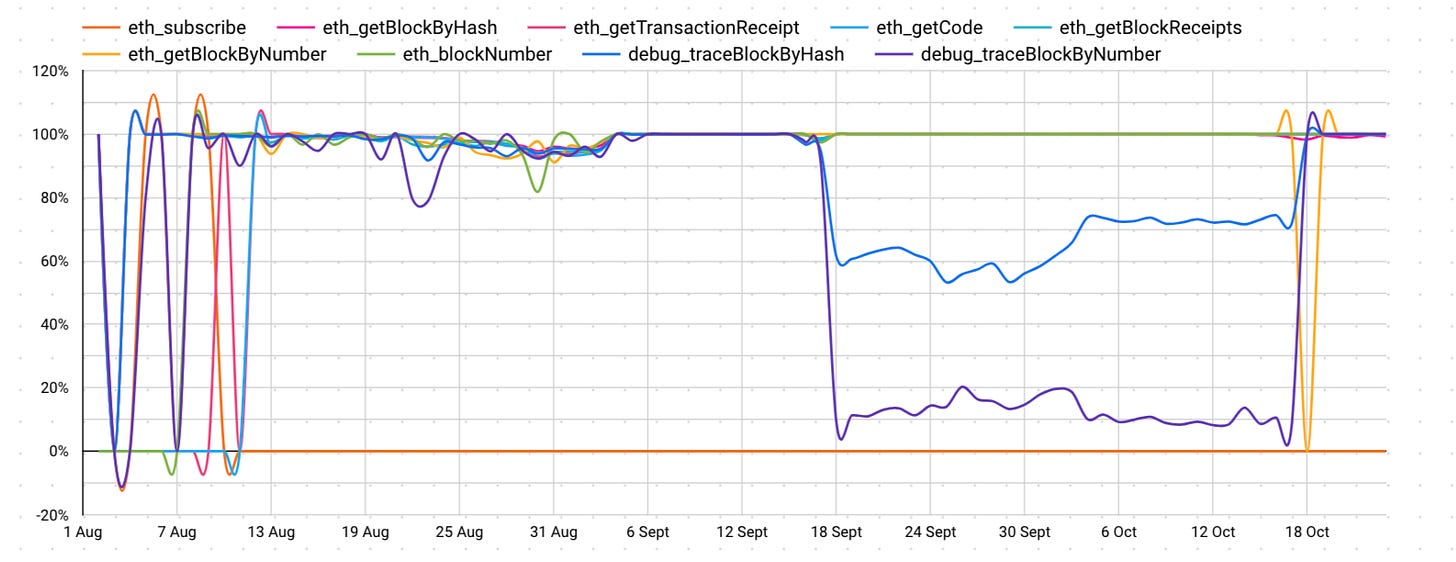
Once again, the obvious might just be “use orange provider” because it performs well. Unfortunately, that doesn’t really work either. When we look at orange provider’s performance for just Ethereum, the archive node methods can have dramatic drops in performance. As you can see for almost one month, archive nodes performed terribly on what was meant to be “the best provider” in our above example.
So if we’re after the best performance for certain methods, we need to look closer.
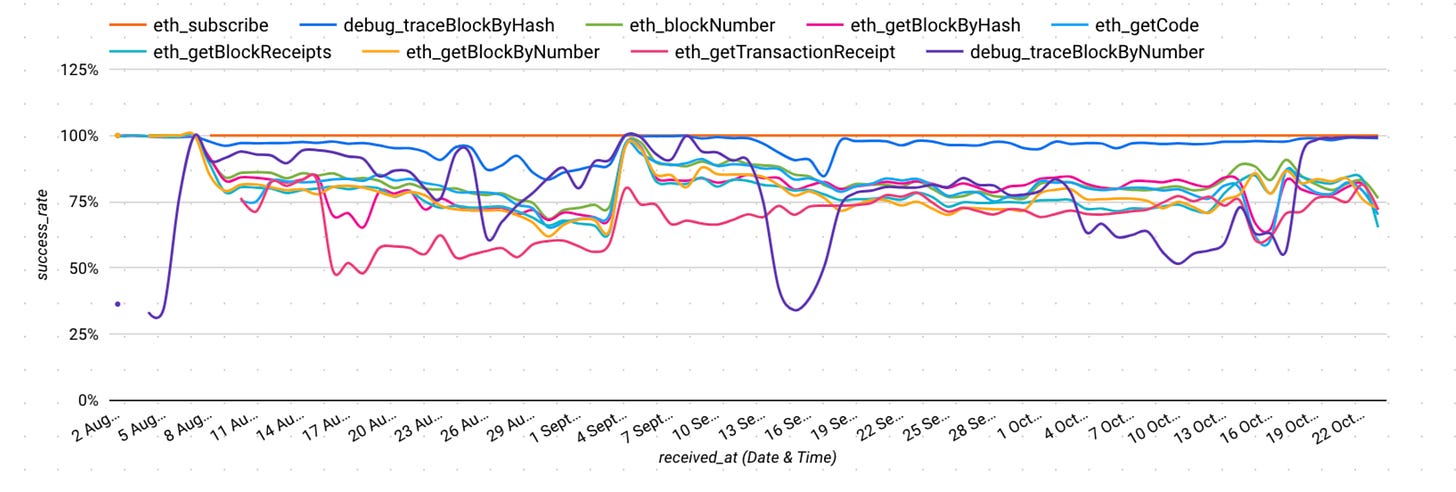
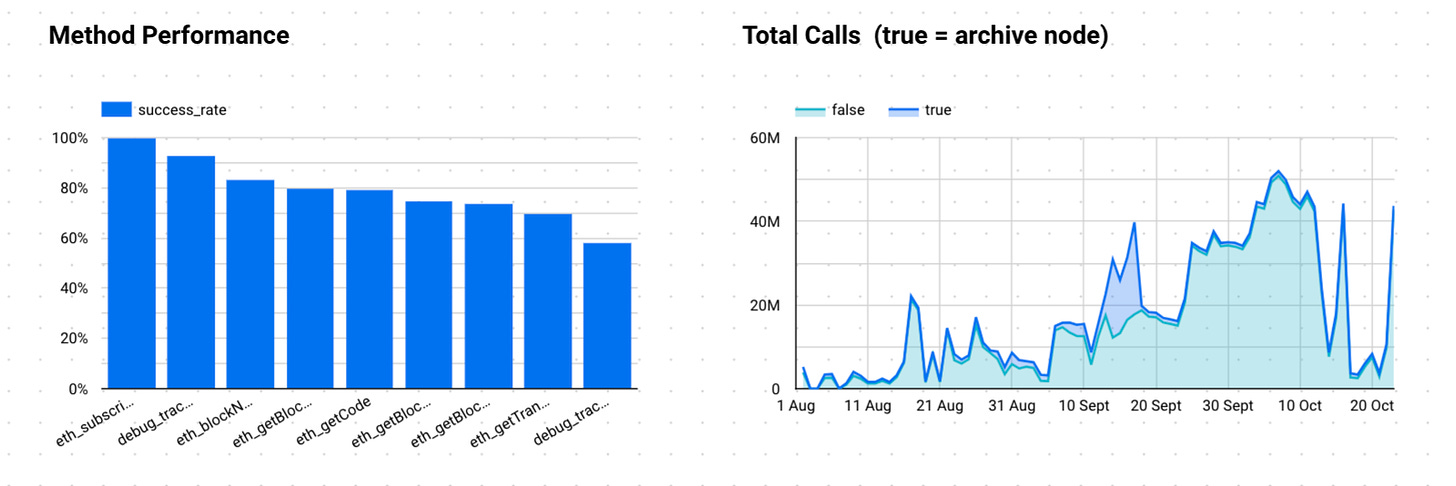
Our final chart below shows how success across various methods changes considerably month-to-month. Depending on if you’re making calls to full nodes versus archive nodes, your performance will vary significantly. We saw this briefly in an isolated example with the single provider on a chain above, but now we have a more zoomed out view.
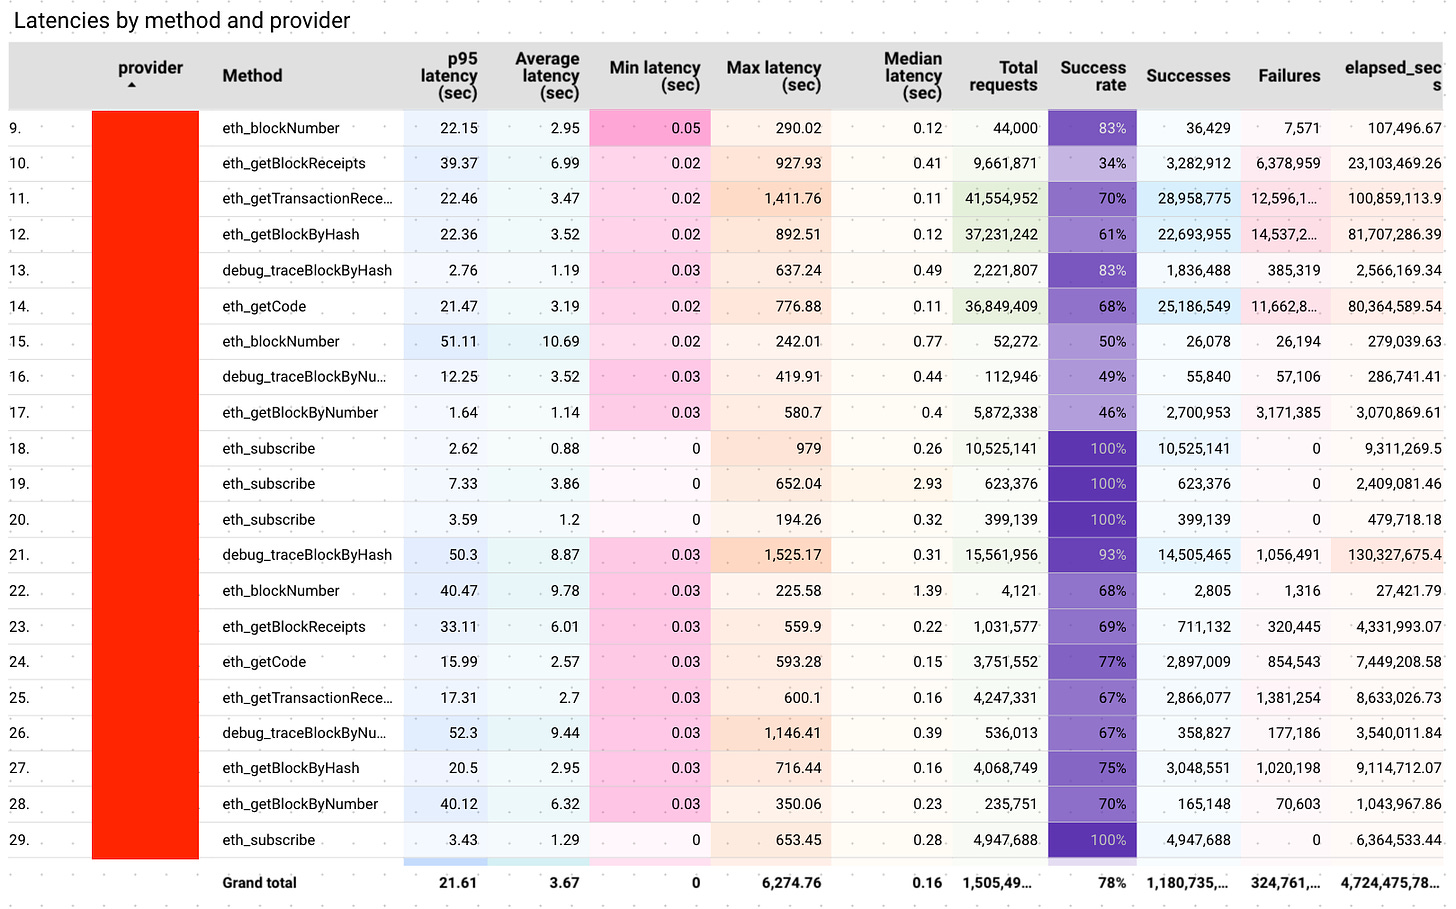
If we average out this data, we get the below breakdown of average success rate per method with the accompanying areas chart showing a breakdown of archive versus non-archive node calls. When you put it like this, you realise just how unreliable nodes can be when you’re looking across many dimensions. Many times, node providers use glossy marketing numbers on limited time frames to market their performance. It isn’t until you hammer them at scale do you see the real metrics.
So what’s the best way to select a node? One line of argument to this complexity may be to just use the orange provider in our above example, however when their systems start failing and experiencing large drop offs, your downstream systems will fail because of them.
One way to avoid this is by having fall-back providers in your system. However, these fall-back providers require manual maintenance and add to latency through sub-optimal routing. Ideally you want to have data on how all these routes perform in a dynamic, intelligent way — rather than static if/else clauses in your code base.
To make matters even more complicated, pricing for every provider changes on a per chain and method basis. These differences be be as much as 10 times the cost per method/chain. Suddenly a 10-20% difference in performance ends up costing you a lot more! Each provider wants to lock you into a yearly plan or a monthly quota which has extra costs. Almost no provider is pure usage based which means you’re forced to take a bet on a single one — without any data! What is a “simple service” on the outset, actually has great variance in performance when inspected closely.
If you’re paying for RPCs or thinking about your infrastructure’s reliability, let’s explore how to maximize performance across chains and providers. Reach out to chat about our findings or to see how we can help.
-
Currently paying for RPCs and want to learn more about how to improve your reliability
-
Are a RPC provider and want to know how your nodes perform
-
Thinking about signing up to a RPC service and would like some advice
Reach out to me directly from this email or by emailing me at k@0xarc.io so we can setup some time to chat.
Read More: kermankohli.substack.com



 Bitcoin
  Ethereum
  Tether
  XRP
XRP  USDC
USDC  Solana
  TRON
TRON  Dogecoin
  Cardano
  Lido Staked Ether
  Wrapped Bitcoin
  LEO Token
  USDS
USDS  Toncoin
  Chainlink
  Wrapped stETH
  Stellar
  Avalanche
  Shiba Inu
  Sui
Sui  Hedera
  MANTRA
  Polkadot
  Bitcoin Cash
  Binance Bridged USDT (BNB Smart Chain)
  Ethena USDe
  Litecoin
  Bitget Token
  WETH
WETH  WhiteBIT Coin
  Pi Network
  Monero
  Wrapped eETH
  Hyperliquid
  Dai
Dai  OKB
OKB  sUSDS
sUSDS  Uniswap
  Pepe
Pepe  NEAR Protocol
  Gate
Gate  Aptos
Aptos  Coinbase Wrapped BTC
  Tokenize Xchange
  Mantle
  Ondo
Ondo  Ethena Staked USDe
  Cronos
  Internet Computer