
Get the best data-driven crypto insights and analysis every week:
By: Kyle Waters & Matías Andrade
In macroeconomics, analysts have long relied upon a set of established indicators to pinpoint the health and trajectory of the economy. The study of macroeconomics is a well-trodden path, rich in historical precedent. In contrast, the crypto-economy, still in its nascent stages, requires creativity and domain expertise to find appropriate indicators. But as the availability of crypto data and our understanding of it has grown, so has the available set of indicators.
While caution must be exercised in over-relying on any single metric in dynamic and unpredictable markets, certain indicators can provide valuable insights. In this week’s edition of State of the Network, we present a selection of indicators that offer us insights against the backdrop of a recent surge in valuations within the digital assets ecosystem.
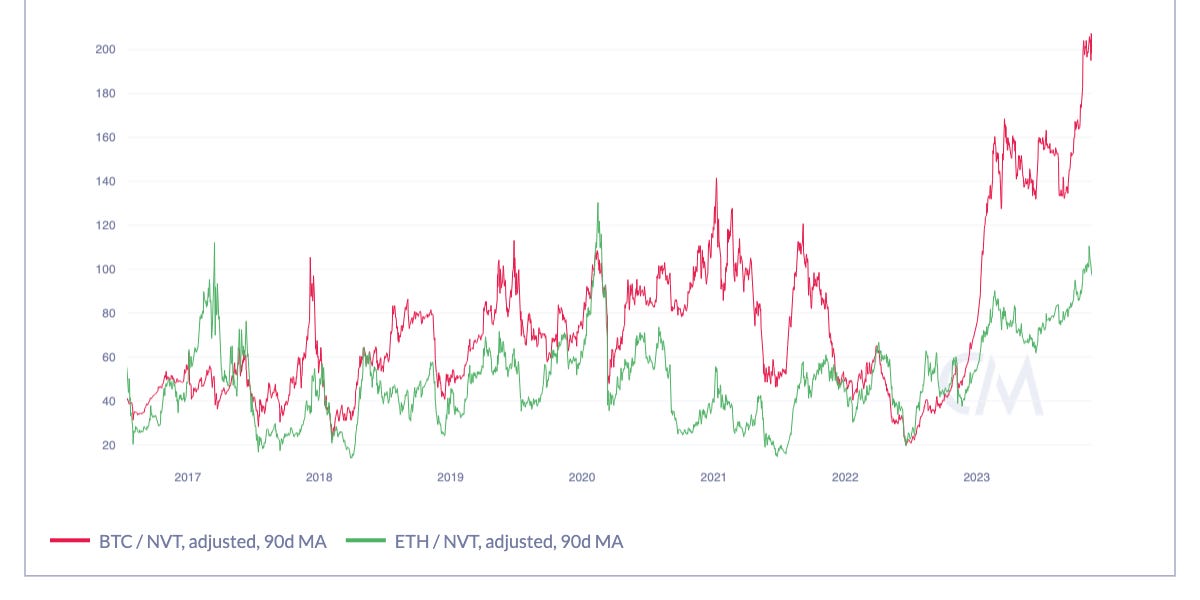
The Network Value to Transfer Value (NVT) ratio, which is the network value (or market capitalization) divided by the adjusted transfer value, offers an interesting view to start with. Essentially, NVT compares a blockchain’s market capitalization against its on-chain transactional activity. A blockchain with a high NVT indicates low usage relative to its market cap, serving as a counterpoint to the concept of velocity. Put simply, a high NVT means that an asset’s valuation is rising much faster than underlying activity on the network. Due to inherent differences in how various blockchains are used, direct comparisons of NVT across different assets can be challenging.
As we can see below, NVT has risen sharply for both BTC and ETH, hinting that their valuations are currently rising faster than underlying transfers. This might be due to a lag in underlying activity, which might pick up in the wake of recent price action.

Source: Coin Metrics Network Data Pro
Moving on to another popular indicator, market value to realized value (MVRV) has historically been one of the most reliable on-chain indicators of bitcoin market tops and bottoms. MVRV is calculated by dividing bitcoin’s market capitalization by its realized capitalization. Realized capitalization can also be thought of as a gross approximation of bitcoin’s aggregate cost basis. Historically, a high ratio of market capitalization to realized capitalization has signaled that bitcoin price was near a local maximum, while a low ratio has indicated that price is near a local minimum.

Source: Coin Metrics Network Data Pro
The few times that MVRV has dropped below one have historically been some of the best times to buy bitcoin. An increasing MVRV indicates that current sentiment is increasing fast relative to estimated aggregate cost basis, while decreasing MVRV signals the opposite. The MVRV of bitcoin has increased recently, but is still below historical levels at 1.8.
We can also examine the relative market capitalizations of different segments within the ecosystem to gauge investor sentiment and trends. The chart below compares the relative market caps within the Ethereum ecosystem, focusing on Ether (ETH), stablecoins, and other ERC-20 tokens in the datonomy™ universe.

Sources: Coin Metrics Network Data Pro & datonomy™
A notable observation is the increasing valuation of ETH and ERC-20 tokens compared to stablecoins. The market capitalization of stablecoins has not kept pace with these other segments. This divergence could indicate a shift in capital from stablecoins, perceived as safer assets, to ETH and ERC-20 tokens, which are generally considered riskier but with greater potential for appreciation in a bull market.
Another intriguing aspect is the market cap ratio of ETH to ERC-20 tokens. There has been a recent decline in this ratio, suggesting that some ERC-20 tokens have experienced more significant gains than ETH. This trend could reflect a growing appetite for risk among investors, as ERC-20 tokens often exhibit higher volatility and are more sensitive to market changes (a higher beta) compared to ETH. This movement towards riskier assets could be propelled by investors chasing higher returns, fueled by optimistic sentiment surrounding the anticipated launch of a bitcoin spot ETF in the U.S., an event seen as a clear catalyst for institutional re-evaluation of the digital assets market.
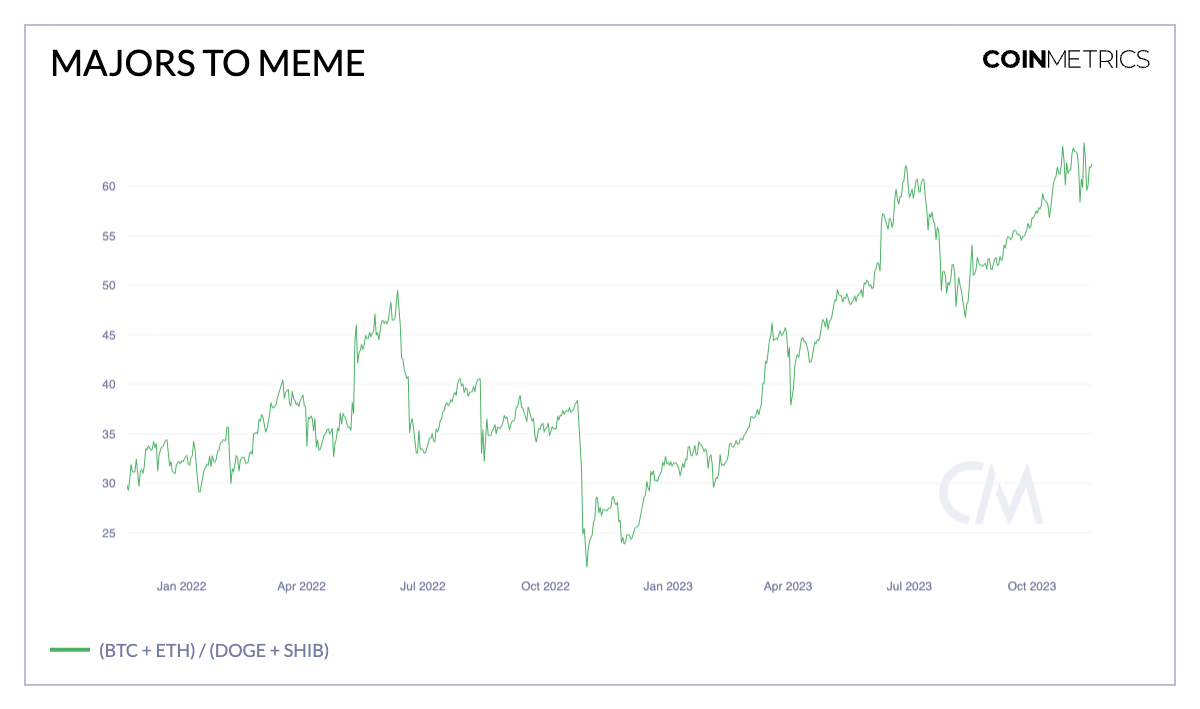
An intriguing trend is the relative underperformance of “meme” coins like DOGE and SHIB compared to BTC and ETH. The “majors-to-meme” ratio below, which compares the combined market value of Bitcoin and Ether to that of Dogecoin and Shiba Inu, now stands at 60x—the highest it has been in over a year. This disparity may reflect a growing investor preference for assets with more established fundamentals and clearer investment theses.
Source: Coin Metrics Network Data
While BTC and ETH are increasingly viewed as ‘quality’ assets due to their broader adoption and more defined roles in the digital economy, meme coins, often driven by retail enthusiasm, lack similar levels of institutional acceptance and clear long-term value propositions.
Exploring on-chain fundamentals provides another valuable perspective. This involves analyzing the real-time data from public ledgers, which offers a view of the adoption and usage of blockchain networks. While adoption generally unfolds over an extended period, on-chain data can help us understand if recent valuation increases are paralleled by a growth in the number of users joining or actively using the network.
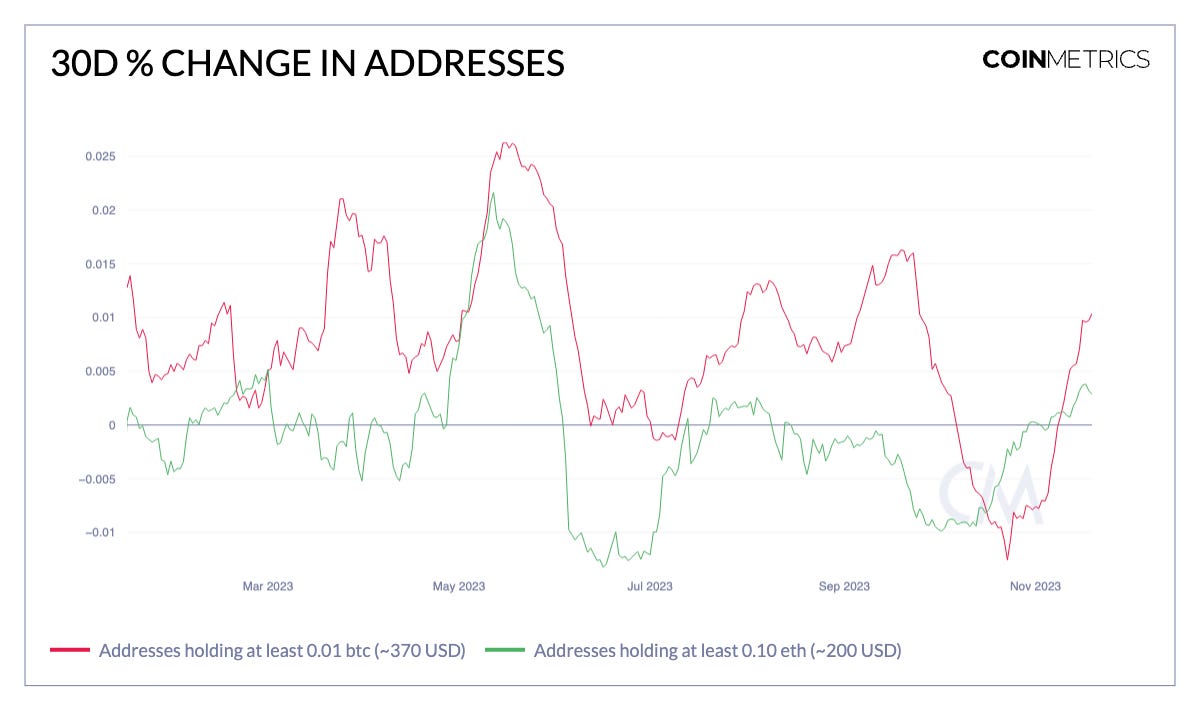
One metric we can look at is the growth in new addresses holding a non-negligible amount of native units. The chart below, with a 30-day moving average, shows that while there has been an uptick in address growth, it hasn’t been markedly significant. In terms of active addresses, Bitcoin has seen a recent increase, but Ethereum has not experienced a similar surge. However, it’s important to note that with the rise of layer-2 networks on Ethereum, the significance of active addresses on its layer 1 as a fundamental metric may be diminishing.
Source: Coin Metrics Network Data
Another important indicator is the fees paid by users. Recently, fees on both Bitcoin and Ethereum have escalated. On November 16th, users paid over $11 million in transaction fees on Bitcoin, exceeding the total fees paid on Ethereum for the first time since December 2020. A significant driver of this increase is the growing interest in ordinals and inscriptions on the Bitcoin network. This surge in activity has resulted in the Bitcoin mempool reaching its highest level of congestion in recent times.

Source: Coin Metrics Network Data
The current digital assets landscape presents a multifaceted picture. While the NVT ratio indicates that valuations are outpacing underlying network usage, MVRV remains historically low. Adding another layer to this complexity is the liquidity of bitcoin in the market, with only a small percentage, <30%, of BTC having been active in the past year. This scenario underscores the importance of not relying too heavily on any single metric or ratio for a complete market assessment.
Market capitalization trends suggest a growing preference for established and ‘quality’ assets, yet there is also noticeable momentum in some altcoins. The recent increase in the total market cap of stablecoins, albeit at a slower pace than the rise in asset prices, could be indicative of new liquidity flowing into the crypto-economy. On-chain activity provides additional nuance. For instance, address growth is only beginning to accelerate, while transaction fees have seen a sharp increase.
Overall, the market shows a mix of bullish indicators. It’s important to approach these signs with some balance, but they could very well be signs of a more significant trend on the horizon.
Source: Coin Metrics Network Data
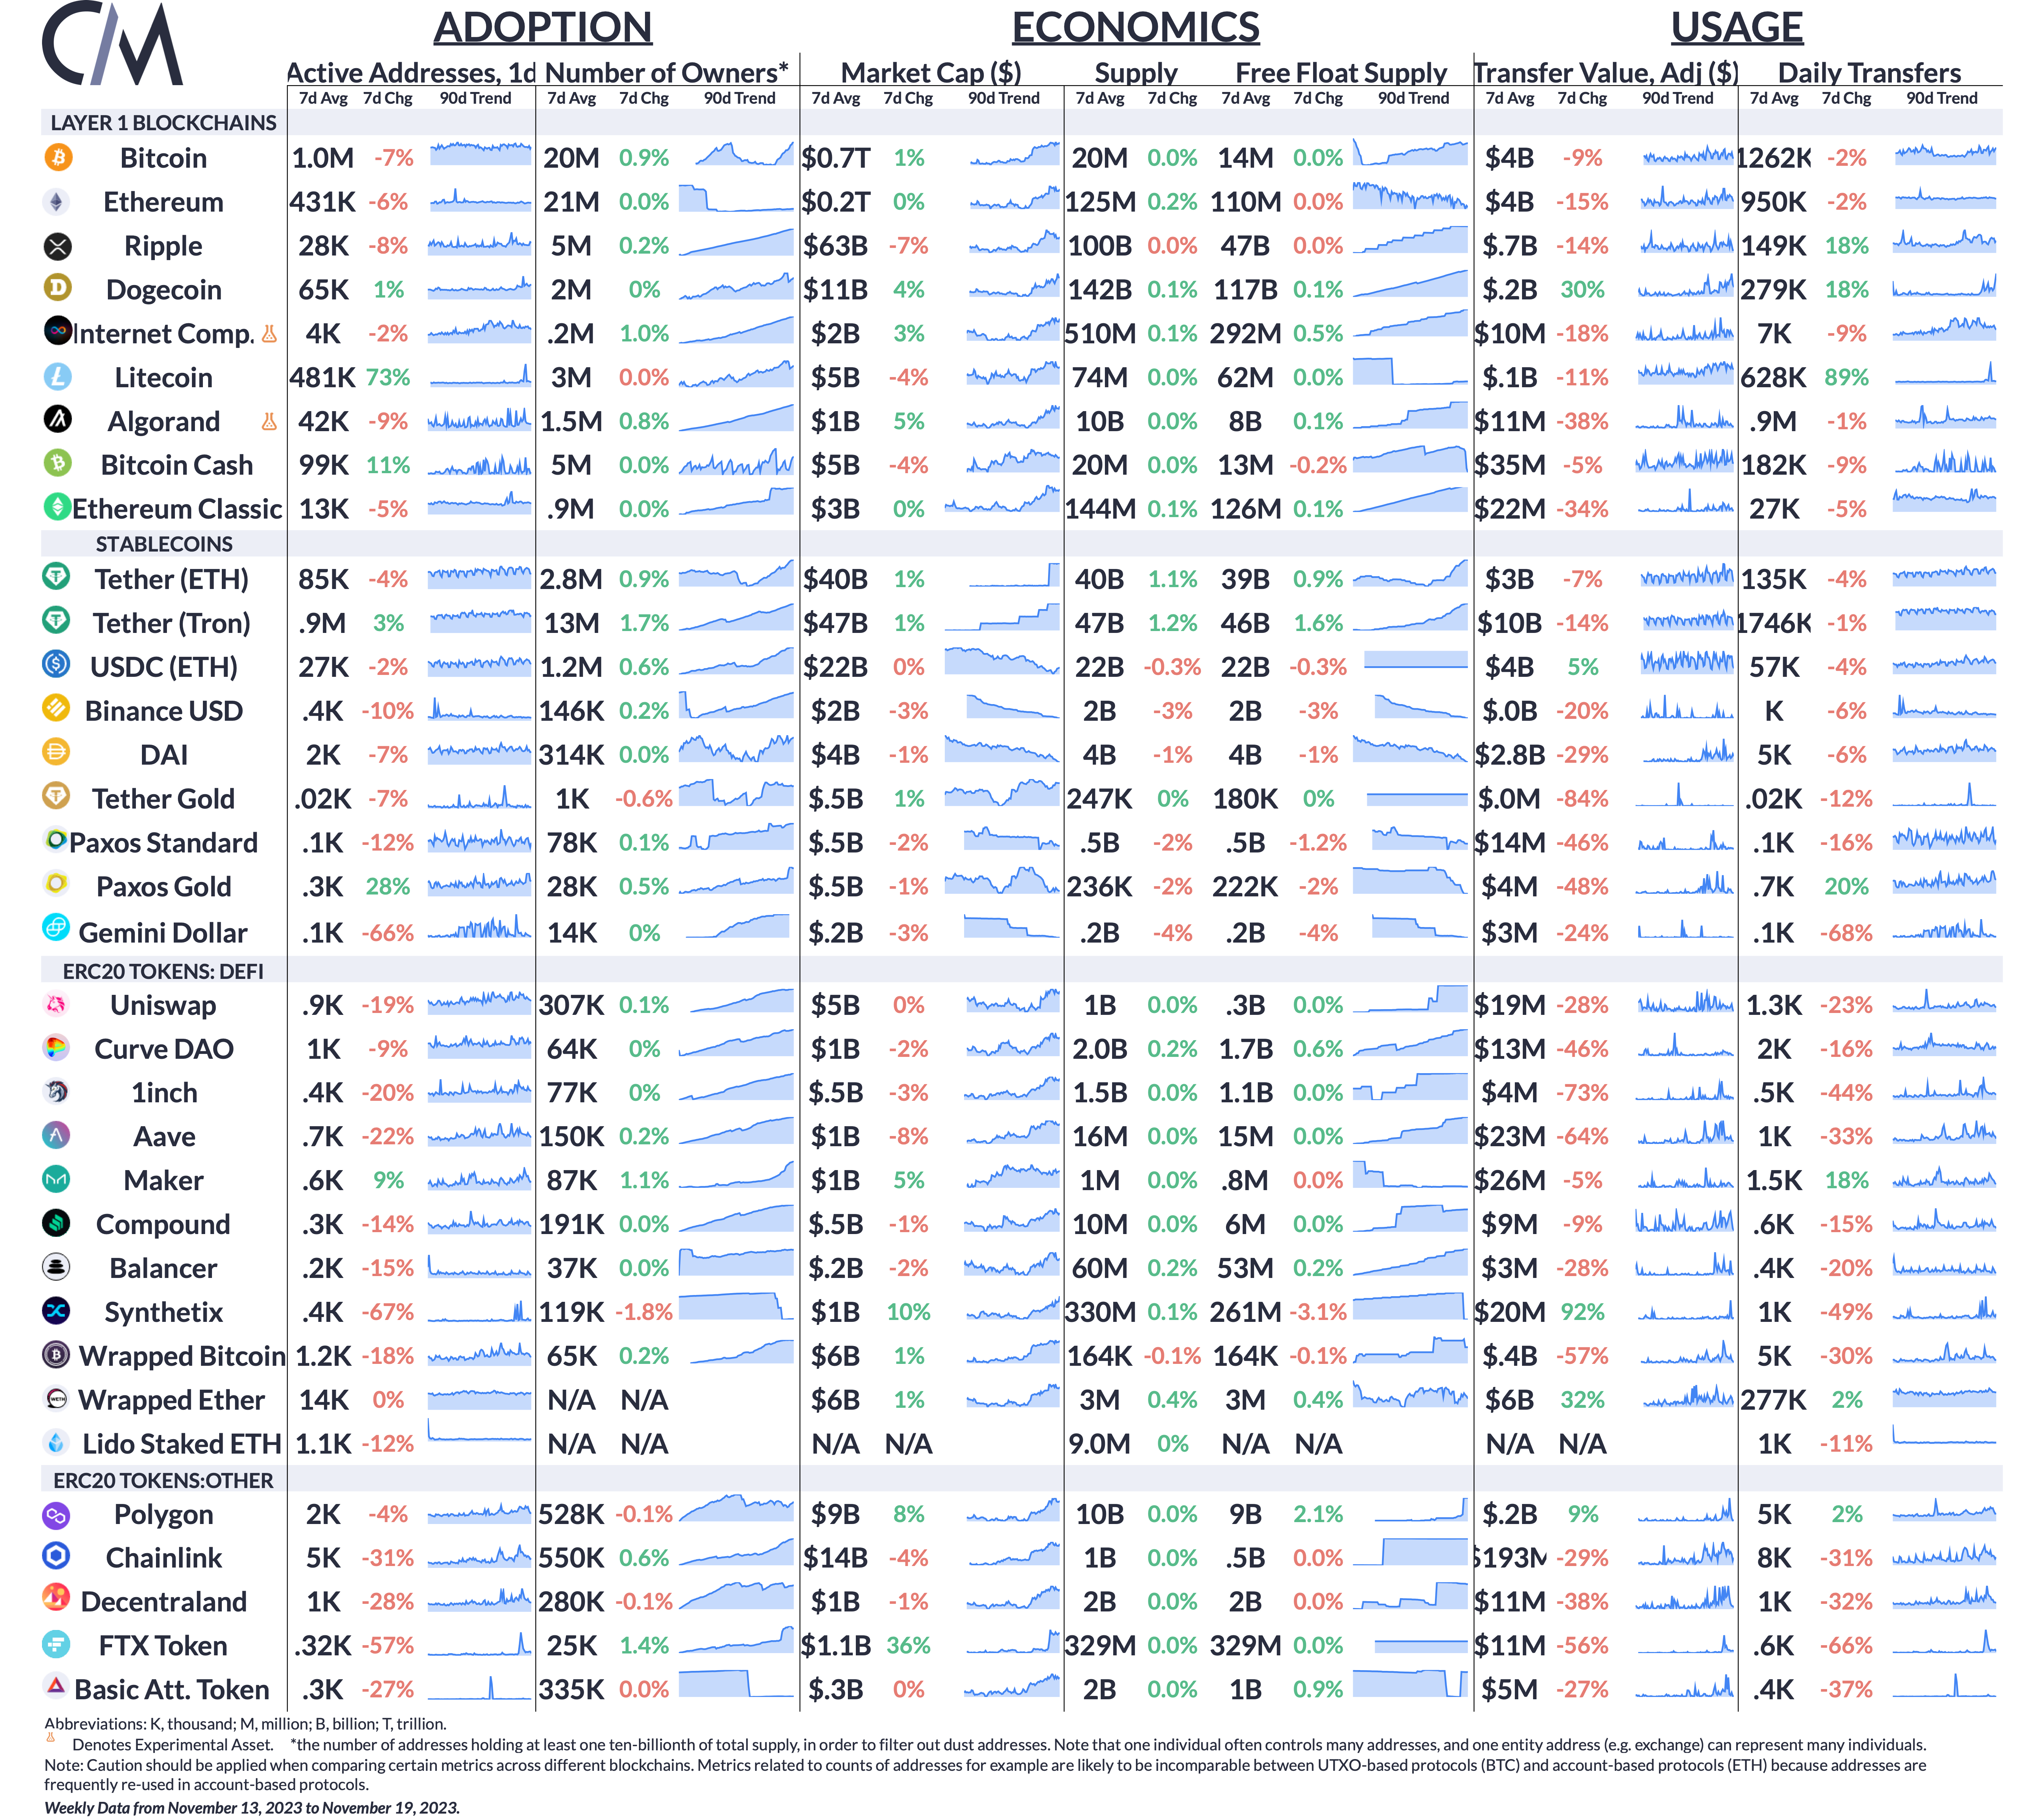
Bitcoin active addresses declined 7% while Ethereum active addresses fell 6% over the week. The market cap of Tether (USDT), continued to push higher to a new all-time high above $87B.
This week’s updates from the Coin Metrics team:
-
Follow Coin Metrics’ latest State of the Market newsletter which contextualizes the week’s crypto market movements with concise commentary from the Coin Metrics team, rich visuals, and timely data.
-
Last week we released a beta version of our tagging data, check out the details of the beta release here.
As always, if you have any feedback or requests please let us know here.
Coin Metrics’ State of the Network, is an unbiased, weekly view of the crypto market informed by our own network (on-chain) and market data.
If you’d like to get State of the Network in your inbox, please subscribe here. You can see previous issues of State of the Network here.
© 2023 Coin Metrics Inc. All rights reserved. Redistribution is not permitted without consent. This newsletter does not constitute investment advice and is for informational purposes only and you should not make an investment decision on the basis of this information. The newsletter is provided “as is” and Coin Metrics will not be liable for any loss or damage resulting from information obtained from the newsletter.
Read More: coinmetrics.substack.com


 Bitcoin
  Ethereum
  Tether
  XRP
XRP  BNB
BNB  Solana
  USDC
USDC  Dogecoin
  Cardano
  Wrapped Bitcoin
  Sui
Sui  Avalanche
  Wrapped stETH
  Stellar
  Shiba Inu
  Hedera
  Toncoin
  Bitcoin Cash
  Hyperliquid
  LEO Token
  USDS
USDS  Litecoin
  Polkadot
  WETH
WETH  Wrapped eETH
  Pepe
Pepe  Pi Network
  Binance Bridged USDT (BNB Smart Chain)
  Coinbase Wrapped BTC
  Ethena USDe
  WhiteBIT Coin
  Bittensor
  NEAR Protocol
  Aptos
Aptos  OKB
OKB  Ondo
Ondo  Aave
Aave  sUSDS
sUSDS  BlackRock USD Institutional Digital Liquidity Fund
  Official Trump