Bitcoin Analysis
Bitcoin’s price increased marginally on Monday and concluded its daily candle +$57.6.
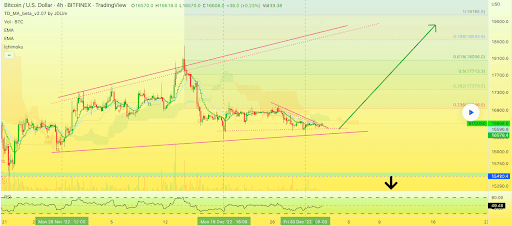
Today we’re beginning our price analyses with the BTC/USD 4HR chart below by AlanSantana. BTC’s price has been consolidating for its next move regardless of direction for many weeks now and its price is trading below the 0.236 fibonacci level [$16,946.5], at the time of writing.
The levels that bullish traders are paying particular attention to on the upside of the 4HR time frame are 0.236, 0.382 [$17,370.5], 0.5 [$17,713.3], 0.618 [$18,056.0], 0.786 [$18,543.9], and the 1 fib level [$19,165.5].
From the perspective of bearish traders that still want to short BTC’s price despite being -75.8% from it’s all-time high [$69,044] and -64.61% for the last 12 months, their primary aim is a retest of Bitcoin’s multi-year low of $15,505.
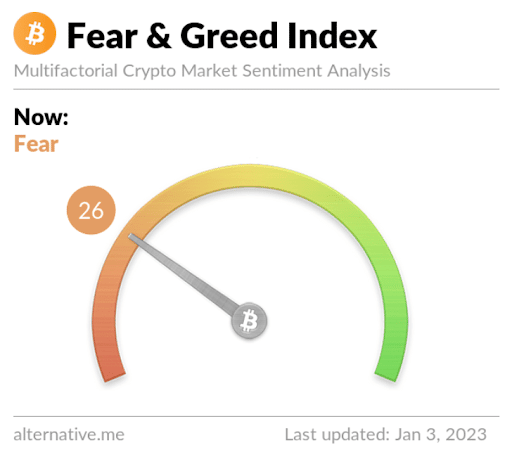
The Fear and Greed Index is 26 Fear and is -1 from Monday’s reading of 27 Fear.
Bitcoin’s Moving Averages: 5-Day [$16,616.75], 20-Day [$16,951.46], 50-Day [$17,613.35], 100-Day [$18,888.34], 200-Day [$24,308.51].
BTC’s 24 hour price range is $16,548-$16,799 and its 7 day price range is $16,548-$16,799. Bitcoin’s 52 week price range is $15,505-$48,162.9.
The price of Bitcoin on this date last year was $47,288.
The average price of BTC for the last 30 days is $16,925.1 and its -2.7% during the same stretch.
Bitcoin’s price [+0.35%] closed its daily candle worth $16,767.7 and in green figures for a second straight day on Monday.
Ethereum Analysis
Ether’s price outperformed BTC’s price on Monday and finished its trading session up over 1% and +$13.39.
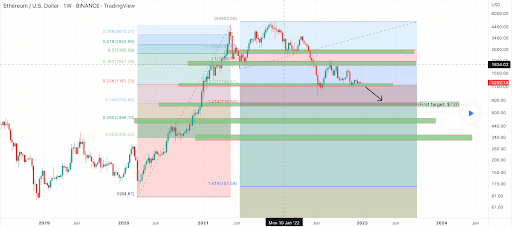
The ETH/USD 1W chart via cryptoonchain is the second chart we’re investigating for this Tuesday. At the time of writing, ETH’s price is trading between the 0.236 fib level [$1,161.23] and the 0.382 fib level [$1,827.28].
The overhead targets on Ether for bulls are 0.382, 0.5 [$2,365.59], 0.618 [$2,903.90], and the 0.786 fibonacci level [$3,670.31].
The downside targets on the 4HR timescale are 0.236, 0.146 [$750.65], 0.0902 [$496.10], 0.055 [$335.52], and a full retracement at 0 [$84.61].
Ether’s Moving Averages: 5-Day [$1,201.18], 20-Day [$1,234.87], 50-Day [$1,295.00], 100-Day [$1,390.66], 200-Day [$1,707.49].
ETH’s 24 hour price range is $1,193-$1,224.29 and its 7 day price range is $1,193-$1,224.29. Ether’s 52 week price range is $883.62-$3,888.86.
The price of ETH on this date in 2022 was $3,831.24.
The average price of ETH for the last 30 days is $1,234.84 and its -6.07% over the same duration.
Ether’s price [+1.12%] closed its daily trading session on Monday worth $1,213.9 and in positive figures for the second consecutive day.
Crypto: Polkadot price analysis
Polkadot’s price was the top performer of the lot covered today by percentage and finished its daily session +$0.116.
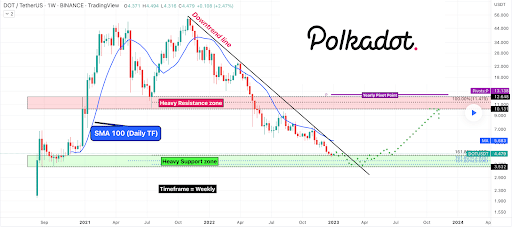
The DOT/USDT 1W chart from pejman_zwin shows that via this interpretation Polkadot’s price is at a heavy support zone. That zone ranges from the $3.54 level to the $4.36 level.
Conversely, overhead resistance for bullish market participants ranges from the $10.16 level to the $12.61 level.
The chartist believes there could be one more leg down before a 200% move to the upside to see the aforementioned overhead range.
Polkadot’s Moving Averages: 5-Day [$4.36], 20-Day [$4.85], 50-Day [$5.48], 100-Day [$6.18], 200-Day [$8.82].
Polkadot’s 24 hour price range is $4.31-$4.56 and its 7 day price range is $4.31-$4.56. DOT’s 52 week price range is $4.23-$30.87.
Polkadot’s price closed its daily session on this date last year worth $30.10.
The average price of DOT over the last 30 days is $4.88 and its -17.66% over the same period.
Polkadot’s price [+2.65%] closed its daily candle worth $4.48 and in positive figures for a second day in a row on Monday.
Read More: news.google.com




 Bitcoin
  Ethereum
  Tether
  XRP
XRP  Solana
  Dogecoin
  USDC
USDC  Cardano
  Lido Staked Ether
  TRON
TRON  Avalanche
  Sui
Sui  Wrapped stETH
  Toncoin
  Chainlink
  Shiba Inu
  Wrapped Bitcoin
  Stellar
  Hedera
  Polkadot
  WETH
WETH  Bitcoin Cash
  LEO Token
  Uniswap
  Litecoin
  Pepe
Pepe  Hyperliquid
  Wrapped eETH
  NEAR Protocol
  USDS
USDS  Ethena USDe
  Internet Computer
  Aptos
Aptos  Aave
Aave  Mantle
  MANTRA
  POL (ex-MATIC)
  Render
  Cronos
  Ethereum Classic
  Monero
  Bittensor
  Artificial Superintelligence Alliance
  Dai
Dai  Tokenize Xchange
  Virtuals Protocol
  Filecoin