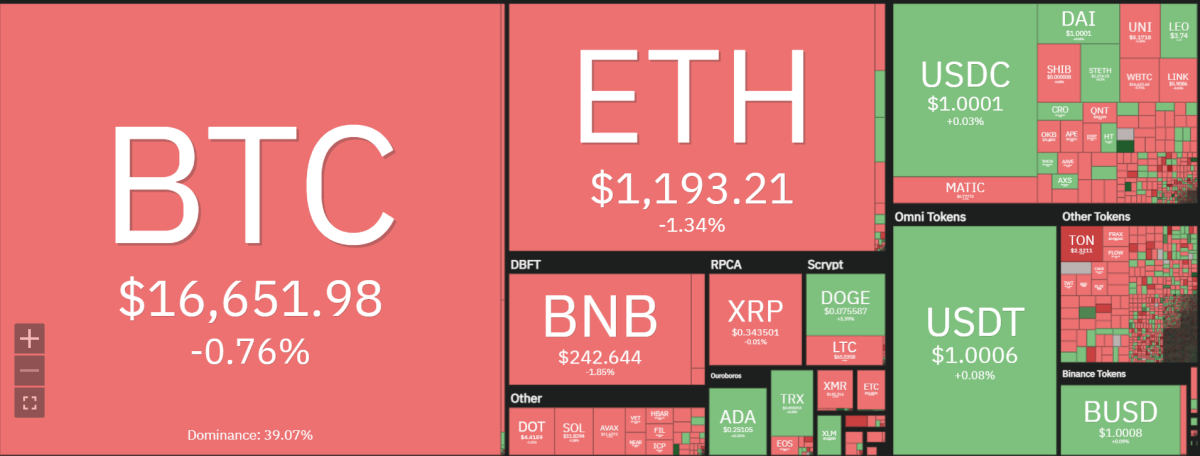
Ethereum price analysis shows ETH has retraced below the $1,200 handle in the last few hours.ETH opened the daily trading session at $1,211.22 and immediately slipped beneath the crucial $1,200 support level. The move marked a new yearly low for ETH, which is now trading at around the $1,100 handle.

At the time of writing, Ethereum is trading at $1,190.66 with 24-hour losses of over 1.70%. The bearish sentiment in the market. The recent correction of Ethereum price has been significant, with ETH’s trading volume declining significantly in the last few days.
However, Ethereum price analysis suggests that ETH could be preparing for a fresh rally if it breaches the $1,200 resistance and holds at this level for a few hours. The market is awaiting a fresh trigger while the entire cryptocurrency tries to stabilize. Most of the cryptocurrencies have registered minor gains in the last few hours as investors remain cautiously optimistic about the near-term outlook.
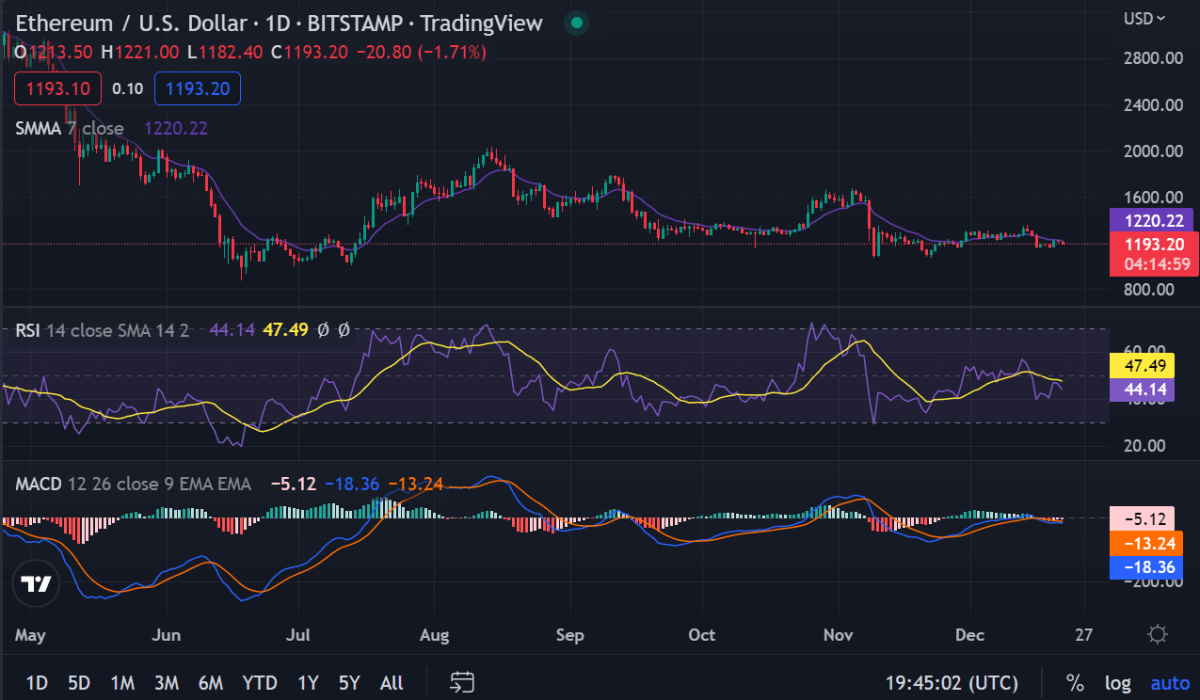
Ethereum price analysis on a daily chart: ETH retraces below $1,200
Ethereum price analysis on a daily chart suggests that ETH has retraced below the crucial $1,200 support level and is now trading at around the $1,100 handle. The recent correction in Ethereum price marks a new yearly low for ETH and this could be an opportunity for investors to capitalize on the current market.

ETH is trading in a bearish trend and has formed two lower highs at $1,210 and $1,190 respectively. The MACD is indicating a bearish sentiment while the RSI is trending around 20. This could indicate that Ethereum is currently oversold in the market and could witness a bounce-back in prices if the bulls can push the price above $1,200.
The moving averages are also indicating a bearish sentiment in the market, with the 50-day MA and 200-day MA trending downwards. The support level was breached when ETH fell below $1,200 and this could be a sign of further downside pressure in the Ethereum price.
ETH/USD 4-hour chart analysis: Bearish divergence indicates further downside
Ethereum price analysis on the 4-hour chart reveals a bearish divergence between the price action and oscillators could indicate that ETH is likely to retest the $1,100 handle in the next few hours. The MACD is indicating a bearish sentiment while the RSI is trending around 40. The moving averages are also pointing to a bearish trend, with the 50-day MA and 200-day MA trending downwards.

Ethereum price analysis suggests that ETH could face further retracement at the $1,100 Fibonacci level if the bears maintain their momentum in the market. However, a break above $1,200 could lead to a fresh rally for ETH and this could be an opportunity for investors to capitalize on the current market sentiment.
The Exponential Moving Average (EMA) crossover of the 4-hour chart is also indicating a bearish sentiment in the market and traders should keep an eye on this indicator for further confirmation. Other moving average crossovers could also be used to confirm the direction of the trend.
Ethereum price analysis conclusion
Overall, Ethereum price analysis shows the bears have managed to breach the crucial $1,200 support level and ETH is currently trading at around the $1,100 handle. The bearish sentiment in the market could further push Ethereum price lower but a break above $1,200 could lead to a fresh rally for ETH. Investors should remain cautious while taking positions in the current market sentiment.
While waiting for Bitcoin to move further, see our Price Predictions on XDC, Cardano, and Curve
Read More: news.google.com


 Bitcoin
  Ethereum
  Tether
  XRP
XRP  Solana
  Dogecoin
  USDC
USDC  Cardano
  Lido Staked Ether
  Avalanche
  TRON
TRON  Shiba Inu
  Toncoin
  Wrapped stETH
  Stellar
  Wrapped Bitcoin
  Polkadot
  Chainlink
  WETH
WETH  Bitcoin Cash
  Sui
Sui  Hedera
  Litecoin
  Pepe
Pepe  LEO Token
  NEAR Protocol
  Uniswap
  Wrapped eETH
  Aptos
Aptos  Internet Computer
  USDS
USDS  Cronos
  Ethereum Classic
  POL (ex-MATIC)
  Artificial Superintelligence Alliance
  Ethena USDe
  Bittensor
  Render
  Filecoin
  Algorand
  Arbitrum
  Dai
Dai  WhiteBIT Coin
  Cosmos Hub
  Stacks
  MANTRA
  OKB
OKB